
Previously, you learned how to display information as an equation, a graph, and as a table. This lesson will focus on using equations, graphs, and tables to solve problems. Read the following situation. Use the graph below to answer the questions. If you need a hint, click on the word hint.
Tanya and James are working together on an experiment in their science class. They are instructed by their teacher to place a beaker full of water over a flame and take temperature readings each minute while it heats for 7 minutes. The graph of their results is shown below.
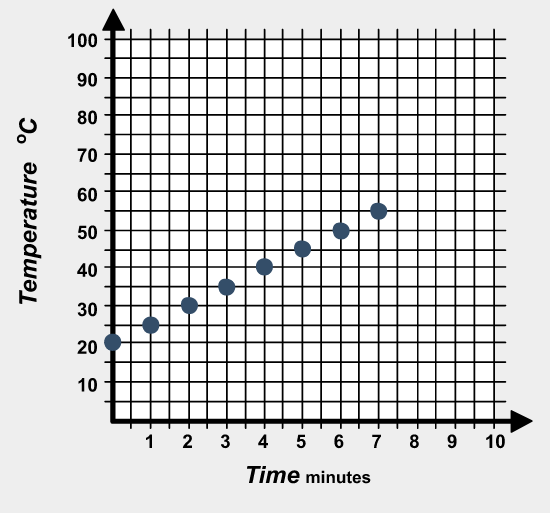
- What was the temperature of the water at 2 minutes?
- How did you find the temperature at 2 minutes from the graph?
- What was the temperature of the water at 3 minutes?
- How did you find the temperature at 3 minutes from the graph?


 An electrician charges a set fee of $50 plus $35 per hour for repairs. Using the equation c = 50 + 35t, what will be the total cost, c, of a repair that takes 6 hours to complete?