Introduction
Percents are representations of rational numbers that you will see frequently in the real world.

- Department stores use percents to advertise discounts.
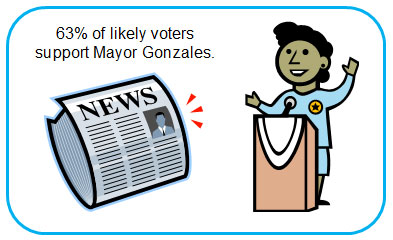
- Survey results are reported as percents.
- Financial information is reported in terms of percent gain or percent loss.

In this lesson, you will learn how to use percents to solve problems and estimate solutions to problems.
Calculating Percents
 A percent is a ratio of a part to the whole set. What makes a percent special is that the ratio is always given as a certain number of parts out of 100.
In this section, you will use a percent bar model to represent different percents of a given number. You will also think about different ways to calculate a percent or to use a percent to calculate a part or the whole.
A percent bar model consists of the following components.
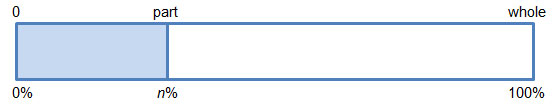
In this model, 0 is at the left end of the percent bar, and 100%, or the whole set, is at the right end of the percent bar. The vertical line marking the part, which is n% of the whole, indicates the proportion of the percent bar representing the part.
Suppose that a store is having a sale on all merchandise. Depending on the type of item, shoppers will receive a particular discount.
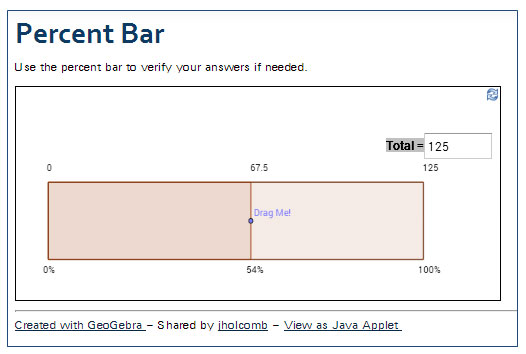
Use the percent bar contained in the interactive below to set up and solve the percent problems that follow. Click on the image to open the interactive, which will open in a new browser tab or window.
- Enter the amount of the whole in the box in the upper right portion of the interactive.
- Drag the point marked on the percent bar to adjust the part.
- Use the information about the part and the percent to answer the question.
Use the interactive to answer the following questions.
Pause and Reflect
1. How could you use a proportion to show the information in the percent bar?
2. If you know the percent, how could you convert the percent to a decimal, and then use the decimal number to solve the problem?
Percent Increases and Percent Decreases
In the last section, you used percent bars and proportions to make calculations involving percents. In this section, you will apply that approach to solving problems involving percent increase or percent decrease.
Use the interactive below to complete the table that follows. Click on the image to open the interactive in a new browser tab or window. Enter the percent of increase or decrease, and observe both the change in the bar height and the expression used to calculate the new values. Use the information in the interactive to complete the table that follows.
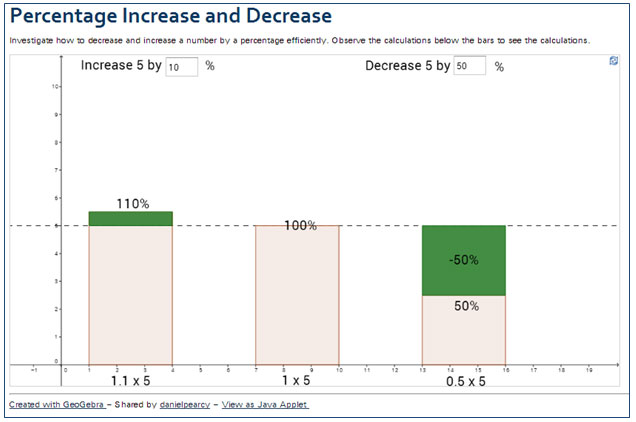
Copy the table below on a piece of paper. Use the interactive to complete the table, and then use the completed table to answer the conclusion questions that follow.
| Percent of Increase | Expression | New Value | Percent of Decrease | Expression | New Value |
|
10%
|
1.1 × 5
|
5.5
|
50%
|
0.5 × 5
|
2.5
|
|
20%
|
|
|
40%
|
|
|
|
30%
|
|
|
30%
|
|
|
|
40%
|
|
|
20%
|
|
|
|
50%
|
|
|
10%
|
|
Conclusion Questions
1. How does the percent of increase compare to the expression used to calculate the new value?
2. How does the new value compare to the original value and the percent of increase?
3. How does the percent of decrease compare to the expression used to calculate the new value?
4. How does the new value compare to the original value and the percent of decrease?
5. Suppose that the original value was 20 instead of 5. How much would a 35% increase from 20 represent?
6. Suppose that the original value was 20, and the new value was 25. What percent increase does this change represent?
Pause and Reflect
When you are calculating the percent increase, should you compare the difference to the original value or the new value? Why?
How would you calculate the percent decrease?
Generalize a formula that you could use to calculate the percent increase or decrease.
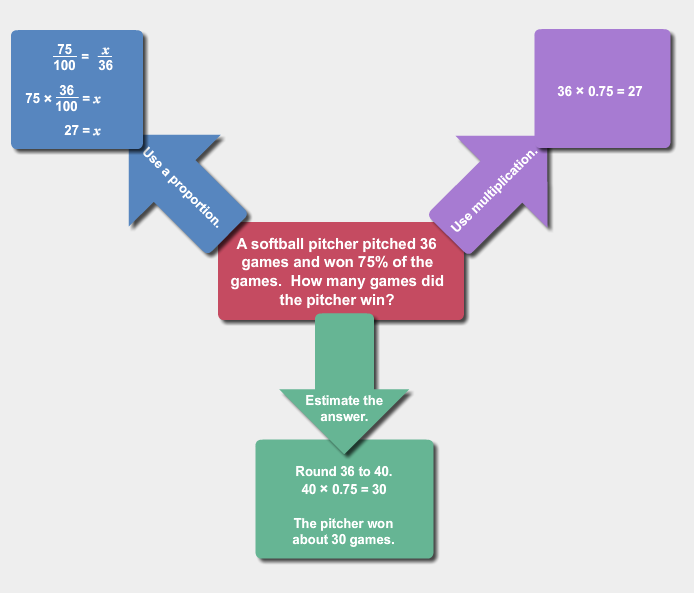
Estimating with Percents
In previous sections, you applied percents in order to solve problems involving discounts, percent increases, and percent decreases. In this section, you will think about different ways that you can estimate when solving problems involving percents. Estimation is an important way to check your answers for reasonableness.
Pause and Reflect
1. How did you use rounding to estimate the solutions to these problems?
2. How did you determine to which place value to round?
Summary
In this lesson, you studied different ways to solve problems relating to percents. You used proportions, arithmetic operations, and estimation strategies when solving problems.