Chapter Review
Concept Items
2.1 Relative Motion, Distance, and Displacement
- One-dimensional motion can have zero distance with a nonzero displacement. Displacement has both magnitude and direction, and it can also have zero displacement with nonzero distance because distance has only magnitude.
- One-dimensional motion can have zero distance with a nonzero displacement. Displacement has both magnitude and direction, but it cannot have zero displacement with nonzero distance because distance has only magnitude.
- One-dimensional motion cannot have zero distance with a nonzero displacement. Displacement has both magnitude and direction, but it can have zero displacement with nonzero distance because distance has only magnitude and any motion will be the distance it moves.
- One-dimensional motion cannot have zero distance with a nonzero displacement. Displacement has both magnitude and direction, and it cannot have zero displacement with nonzero distance because distance has only magnitude.
In which example would you be correct in describing an object in motion while your friend would also be correct in describing that same object as being at rest?
- You are driving a car toward the east and your friend drives past you in the opposite direction with the same speed. In your frame of reference, you will be in motion. In your friend’s frame of reference, you will be at rest.
- You are driving a car toward the east and your friend is standing at the bus stop. In your frame of reference, you will be in motion. In your friend’s frame of reference, you will be at rest.
- You are driving a car toward the east and your friend is standing at the bus stop. In your frame of reference, your friend will be moving toward the west. In your friend’s frame of reference, he will be at rest.
- You are driving a car toward the east and your friend is standing at the bus stop. In your frame of reference, your friend will be moving toward the east. In your friend’s frame of reference, he will be at rest.
- displacement
- distance
- both distance and displacement
- the sum of distance and displacement
2.2 Speed and Velocity
- speed
- distance
- magnitude of displacement
- position vector
- Both instantaneous speed and instantaneous velocity are the same, even when there is a change in direction.
- Instantaneous speed and instantaneous velocity cannot be the same even if there is no change in direction of motion.
- Magnitude of instantaneous velocity is equal to instantaneous speed.
- Magnitude of instantaneous velocity is always greater than instantaneous speed.
2.3 Position vs. Time Graphs

How are average velocity for only the first four seconds and instantaneous velocity related? What is the runner’s net displacement over the time shown?
- The net displacement is 12 m and the average velocity is equal to the instantaneous velocity.
- The net displacement is 12 m and the average velocity is two times the instantaneous velocity.
- The net displacement is 10 + 12 = 22 m and the average velocity is equal to the instantaneous velocity.
- The net displacement is 10 + 12 = 22 m and the average velocity is two times the instantaneous velocity.
2.4 Velocity vs. Time Graphs
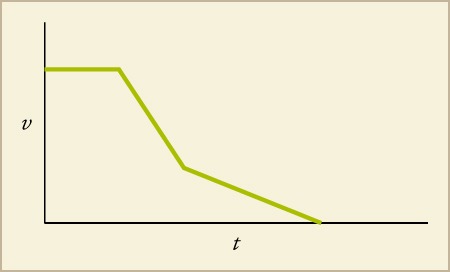
- The ship is moving in the forward direction at a steady rate. Then it accelerates in the forward direction and then decelerates.
- The ship is moving in the forward direction at a steady rate. Then it turns around and starts decelerating, while traveling in the reverse direction. It then accelerates, but slowly.
- The ship is moving in the forward direction at a steady rate. Then it decelerates in the forward direction, and then continues to slow down in the forward direction, but with more deceleration.
- The ship is moving in the forward direction at a steady rate. Then it decelerates in the forward direction, and then continues to slow down in the forward direction, but with less deceleration.
Critical Thinking Items
2.1 Relative Motion, Distance, and Displacement
- Yes, both persons will describe the same motion because motion is independent of the frame of reference.
- Yes, both persons will describe the same motion because they will perceive the other as moving in the backward direction.
- No, the motion described by each of them will be different because motion is a relative term.
- No, the motion described by each of them will be different because the motion perceived by each will be opposite to each other.
- Passenger B sees that the ball has vertical, but no horizontal, motion. Observer C sees the ball has vertical as well as horizontal motion.
- Passenger B sees the ball has vertical as well as horizontal motion. Observer C sees the ball has the vertical, but no horizontal, motion.
- Passenger B sees the ball has horizontal but no vertical motion. Observer C sees the ball has vertical as well as horizontal motion.
- Passenger B sees the ball has vertical as well as horizontal motion. Observer C sees the ball has horizontalbut no vertical motion.
2.2 Speed and Velocity
- No, it reflects speed but not the direction.
- No, it reflects the average speed of the car.
- Yes, it sometimes reflects instantaneous velocity of the car.
- Yes, it always reflects the instantaneous velocity of the car.
Terri, Aaron, and Jamal all walked along straight paths. Terri walked 3.95 km north in 48 min. Aaron walked 2.65 km west in 31 min. Jamal walked 6.50 km south in 81 min. Which of the following correctly ranks the three boys in order from lowest to highest average speed?
- Jamal, Terri, Aaron
- Jamal, Aaron, Terri
- Terri, Jamal, Aaron
- Aaron, Terri, Jamal
- Logan’s average velocity = .
- Logan’s average velocity = .
- Logan’s average velocity = .
- Logan’s average velocity = .
2.3 Position vs. Time Graphs
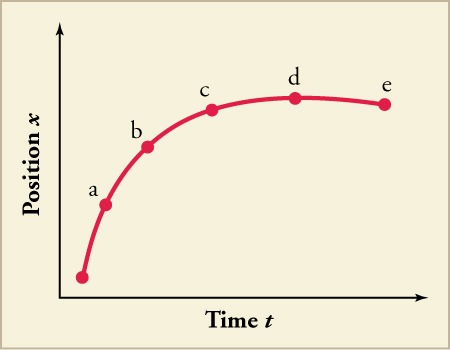
- Instantaneous velocity is greatest at , zero at and negative at .
- Instantaneous velocity is greatest at , zero at and negative at .
- Instantaneous velocity is greatest at , zero at and negative at .
- Instantaneous velocity is greatest at , zero at and negative at .
2.4 Velocity vs. Time Graphs

- The instantaneous velocity is greatest at f, and it is negative at d, h, I, j, and k.
- The instantaneous velocity is greatest at e, and it is negative at a, b, and f.
- The instantaneous velocity is greatest at f, and it is negative at d, h, I, j, and k
- The instantaneous velocity is greatest at d, and it is negative at a, b, and f.
Problems
2.1 Relative Motion, Distance, and Displacement
- Distance is and displacement is .
- Distance is and displacement is .
- Distance is and displacement is .
- Distance is and displacement is .
Billy drops a ball from a height of 1 m. The ball bounces back to a height of 0.8 m, then bounces again to a height of 0.5 m, and bounces once more to a height of 0.2 m. Up is the positive direction. What are the total displacement of the ball and the total distance traveled by the ball?
- The displacement is equal to -4 m and the distance is equal to 4 m.
- The displacement is equal to 4 m and the distance is equal to 1 m.
- The displacement is equal to 4 m and the distance is equal to 1 m.
- The displacement is equal to -1 m and the distance is equal to 4 m.
2.2 Speed and Velocity
- 7.27 m
- 79 m
- 285 km
- 1026 m
2.3 Position vs. Time Graphs
- The total average velocity is 0 m/s.
- The total average velocity is 1.2 m/s.
- The total average velocity is 1.5 m/s.
- The total average velocity is 3.0 m/s.
- The first 15 minutes is a curve that is concave upward, the middle portion is a straight line with slope 100 miles/hour, and the last portion is a concave downward curve.
- The first 15 minutes is a curve that is concave downward, the middle portion is a straight line with slope 100 miles/hour, and the last portion is a concave upward curve.
- The first 15 minutes is a curve that is concave upward, the middle portion is a straight line with slope zero, and the last portion is a concave downward curve.
- The first 15 minutes is a curve that is concave downward, the middle portion is a straight line with slope zero, and the last portion is a concave upward curve.
2.4 Velocity vs. Time Graphs
You are characterizing the motion of an object by measuring the location of the object at discrete moments in time. What is the minimum number of data points you would need to estimate the average acceleration of the object?
- 1
- 2
- 3
- 4

- It is negative and smaller in magnitude than the initial acceleration.
- It is negative and larger in magnitude than the initial acceleration.
- It is positive and smaller in magnitude than the initial acceleration.
- It is positive and larger in magnitude than the initial acceleration.
Calculate the net displacement using seven different divisions. Calculate it again using two divisions: 0 → 40 s and 40 → 70 s . Compare. Using both, calculate the average velocity.
- Displacement and average velocity using seven divisions are 14,312.5 m and 204.5 m/s while with two divisions are 15,500 m and 221.4 m/s respectively.
- Displacement and average velocity using seven divisions are 15,500 m and 221.4 m/s while with two divisions are 14,312.5 m and 204.5 m/s respectively.
- Displacement and average velocity using seven divisions are 15,500 m and 204.5 m/s while with two divisions are 14,312.5 m and 221.4 m/s respectively.
- Displacement and average velocity using seven divisions are 14,312.5 m and 221.4 m/s while with two divisions are 15,500 m and 204.5 m/s respectively.
Performance Task
2.4 Velocity vs. Time Graphs
The National Mall in Washington, DC, is a national park containing most of the highly treasured memorials and museums of the United States. However, the National Mall also hosts many events and concerts. The map in Figure 2.32 shows the area for a benefit concert during which the president will speak. The concert stage is near the Lincoln Memorial. The seats and standing room for the crowd will stretch from the stage east to near the Washington Monument, as shown on the map. You are planning the logistics for the concert. Use the map scale to measure any distances needed to make the calculations below.

The park has three new long-distance speakers. They would like to use these speakers to broadcast the concert audio to other parts of the National Mall. The speakers can project sound up to 0.35 miles away but they must be connected to one of the power supplies within the concert area. What is the minimum amount of wire needed for each speaker, in miles, in order to project the audio to the following areas? Assume that wire cannot be placed over buildings or any memorials.
Part A. The center of the Jefferson Memorial using power supply 1 (This will involve an elevated wire that can travel over water.)
Part B. The center of the Ellipse using power supply 3 (This wire cannot travel over water.)
Part C. The president’s motorcade will be traveling to the concert from the White House. To avoid concert traffic, the motorcade travels from the White House west down E Street and then turns south on 23rd Street to reach the Lincoln memorial. What minimum speed, in miles per hour to the nearest tenth, would the motorcade have to travel to make the trip in 5 minutes?
Part D. The president could also simply fly from the White House to the Lincoln Memorial using the presidential helicopter, Marine 1. How long would it take Marine 1, traveling slowly at 30 mph, to travel from directly above the White House landing zone (LZ) to directly above the Lincoln Memorial LZ? Disregard liftoff and landing times and report the travel time in minutes to the nearest minute.