Ordering Integers on a Number Line
In 6th and 7th grade you learned how to put whole numbers and integers in order and compare them to each other. A number line is a useful tool to keep these numbers organized. Let's review the basic characteristics of a number line.
In your notes, answer the following questions:
- How does the difference between consecutive whole numbers change as the numbers get bigger?
- How can we show this characteristic on a number line?
- Which are greater in value, positive numbers or negative numbers?
- How can we show this characteristic on a number line?
- What is the highest positive number?
- How can we show this characteristic on a number line?
- What is the lowest negative number?
- How can we show this characteristic on a number line?
Which of the following is the best to use for a number line?
Placing Decimals and Percents on the Number Line
Now that we have placed integers on the number line, let's examine the values between the integers. Remember that there are numbers between any two other numbers on a number line. One way to represent the numbers between whole numbers is by using a decimal.
Consider the following situation:
Mike is looking through the pockets of his jeans before putting them in the washing machine. He finds 2 one dollar bills, a quarter, and a nickel.
- How much money did he find?
- How do you write this amount as a decimal number?
- Between what two whole numbers would you find $2.30?
- Which whole number is $2.30 closest to?
- In relationship to $2 and $3, where on a number line would $2.30 be located?
Here's another example:
Where would you place 2.4 on a number line? Why?
Click here to see the completed table.
Where do the following values belong on the number line below?
- 25%
- 2.15
- -30%
- 0.6
- 1.3
- -0.4
Click on the plus sign to check your answer.
Comparing Fractions
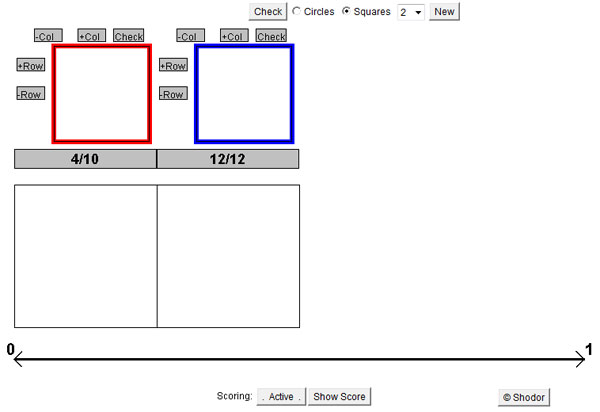
Another way to represent the numbers in between whole numbers is by using fractions. All rational numbers can be written as a fraction with one integer—called the numerator—on the top and another integer—called the denominator—on the bottom. These fractions represent parts of a whole number. In the following applet, you can make a visual image of these fractions by shading in part of a square.
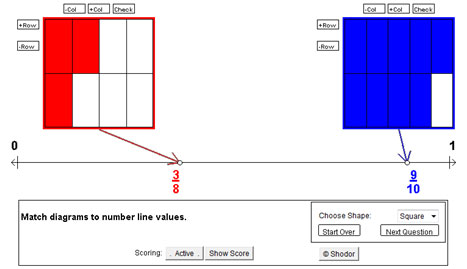
Click on the image below to access the activity. You will divide the square into equal-sized pieces and then click to shade the part of the square that is the same as the fraction shown.
Source: Fraction sorter, Shodor
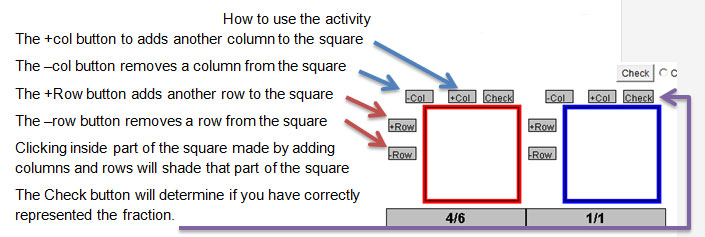
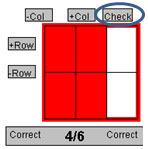
Instructions
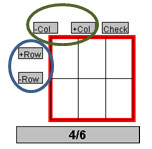
- Use the +Col, -Col, +Row, and –Row buttons to divide the square into the same number of equal-sized pieces as the denominator of the fraction (or a simpler equivalent fraction).
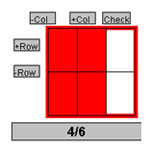
- Click to shade the same number of these pieces as the numerator.
- Click the check button to see if you have correctly represented the fraction.
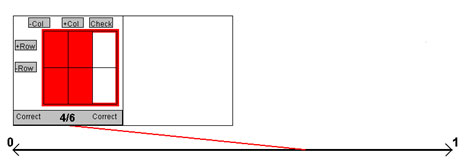
- Drag the fraction into the empty square below it to see the fraction plotted on the number line.
- Repeat for 5 pairs of fractions.
On a piece of paper, fill in the following chart:
| Fraction 1 | picture | Fraction 2 | picture | Which was greater? |
In your notes, list two things that you noticed about what makes one fraction have a greater value than another fraction.
Placing Fractions on the Number Line
Now that we have had some practice representing the values of fractions, we need to look at how their values compare to one another. The following activity will ask you to create images that represent the values of two fractions and then to determine a fraction whose value lies between the two that were given.
Click on the image below to access the activity. You will divide the square into equal-sized pieces and then click to shade the part of the square that is the same as the fraction shown.
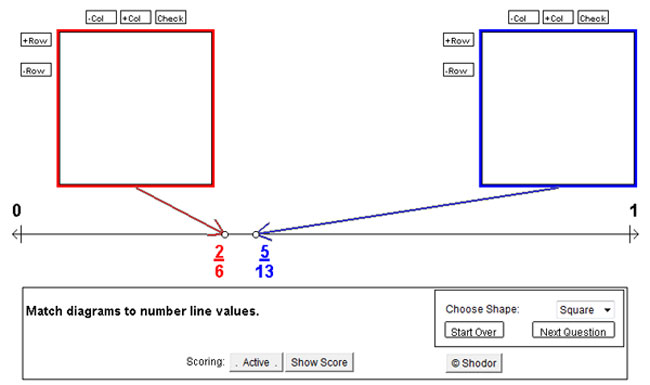
Instructions
- Use the +Col, -Col, +Row, and –Row buttons to divide the square into the same number of equal-sized pieces as the denominator of the fraction (or a simpler equivalent fraction).
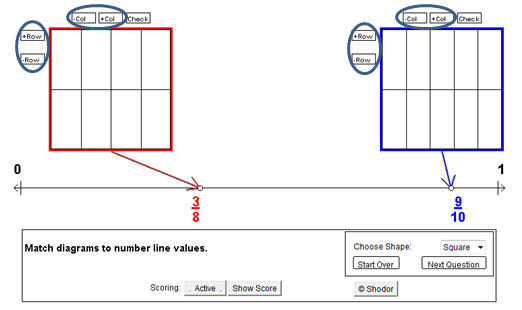
- Click to shade the same number of these pieces as the numerator of the fraction.
- Click the check button to see if you have correctly represented the fraction. When you have correctly created pictures for each fraction, a third box will appear.
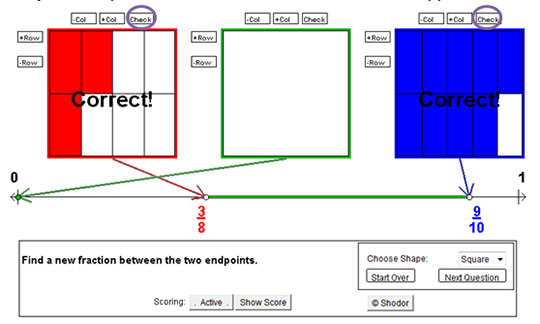
- Use the buttons to create an image that represents a fraction that falls between the red and blue fractions.
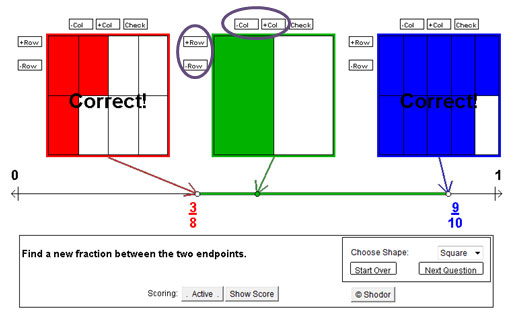
- When you click the 'Check' button, a space will appear for you to type in the value of the fraction you created.
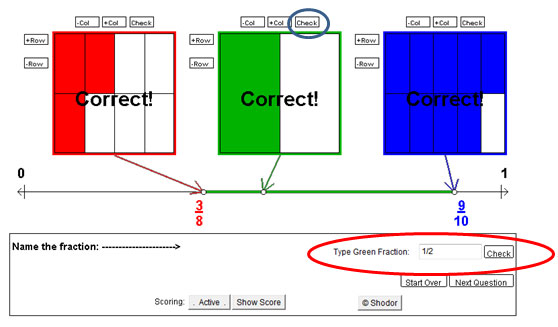
On a piece of paper, fill in the following table:
| Red Fraction | Picture | Blue Fraction | Picture | Green Fraction | Picture |
When you are able to make a good sketch of a fraction, you can use this method to compare fractions. Fractions like halves, thirds, fourths, eighths, etc. are relatively easy to model with a picture. This may not always be the case. If the fractions that you are comparing are difficult to model with a drawing, you may want to use a calculator to convert them to decimals and then use the number line like in section 2. To convert a fraction into a decimal, divide the numerator by the denominator.
Use a calculator to complete the following table in your notes.
|
Fraction
|
|
|
|
|
|
Summary, Generalizations, and Examples
In this resource we have covered how to compare numbers and put them in order. Some of the most important things to remember when you are trying to put whole numbers, decimals, and fractions in order are
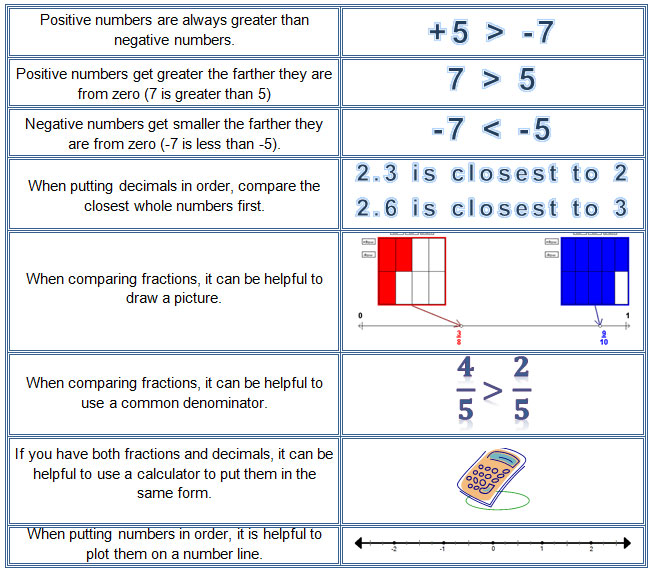
Try the following three example problems.
Example 1:
Michelle wants to obtain a loan from a bank to buy her first car. The annual interest rates charged by four banks are shown in the table below.
| Bank | Interest Rate |
| A |
% |
| B | 8.75% |
| C | % |
| D | 8.675% |
At which bank would Michelle pay the least amount of money in interest?
Example 2:
Sarah is going to the Fun Casino at her school carnival. Every player gets the following list of all the games printed with the odds of winning given as either a fraction or percent:
| Game | Odds |
| Dancing Dice | 45% |
| Lucky Duck | |
| Big Wheel-O-Fun | 30% |
| Flip Happy Coins | |
| Guess My Number |
List the games in order of odds to win from least to greatest.
Example 3:
A student is measuring the temperatures of different liquids. The temperatures are recorded in the following data chart.
| Sample | Temperature(°C) |
| A | -1.3 |
| B | 3.0 |
| C | -0.6 |
| D | -1.9 |
| E | 0.8 |
List the temperatures from greatest to least.