Let's Get Started
Given a situation that can be modeled by a quadratic function or the graph of a quadratic function, determine the domain and range of the function.
TEKS Standards and Student Expectations
A(6) Quadratic functions and equations. The student applies the mathematical process standards when using properties of quadratic functions to write and represent in multiple ways, with and without technology, quadratic equations. The student is expected to:
A(6)(A) determine the domain and range of quadratic functions and represent the domain and range using inequalities
Resource Objective(s)
To determine the domain and range of a quadratic function when given a statement or graph.
Essential Questions
How do you determine the domain and range of a quadratic function when given its graph?
How do you determine the domain and range of a quadratic function when given a verbal statement?
Vocabulary
Investigating Domain and Range Using Graphs
We're going to explore different representations of quadratic functions, including graphs, verbal descriptions, and tables. We'll determine the domain and range of the quadratic function with these representations.
Let's first examine graphs of quadratic functions, and learn how to determine the domain and range of a quadratic function from the graph.
A quadratic equation is any equation/function with a degree of 2 that can be written in the form y = ax2 + bx + c, where a, b, and c are real numbers, and a does not equal 0. Its graph is called a parabola. The constants a, b, and c are called the parameters of the equation. The values of a, b, and c determine the shape and position of the parabola.
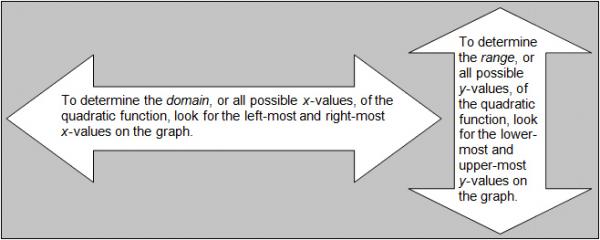
The domain of a function is the set of all real values of x that will give real values for y. The range of a function is the set of all real values of y that you can get by plugging real numbers into x.
Example 1
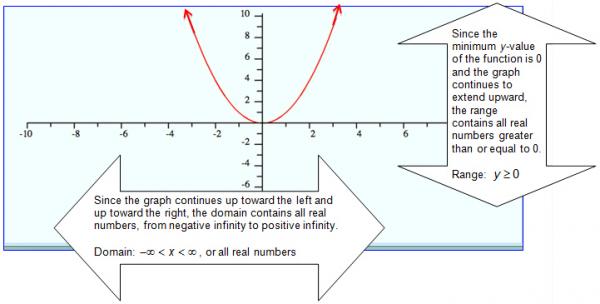
The quadratic parent function is y = x2. The graph of this function is shown below.
Example 2
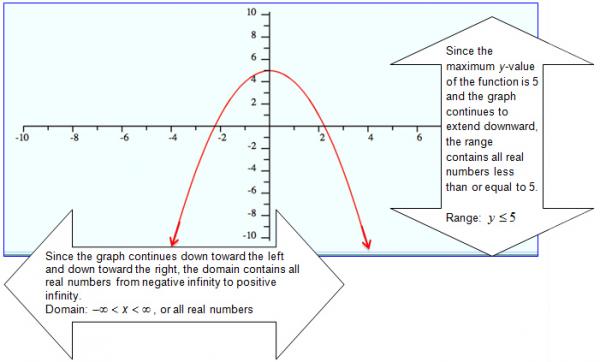
The graph of y = -x2 + 5 is shown below. Determine the domain and range of the function, and check to see if you interpreted the graph correctly.
Example 3
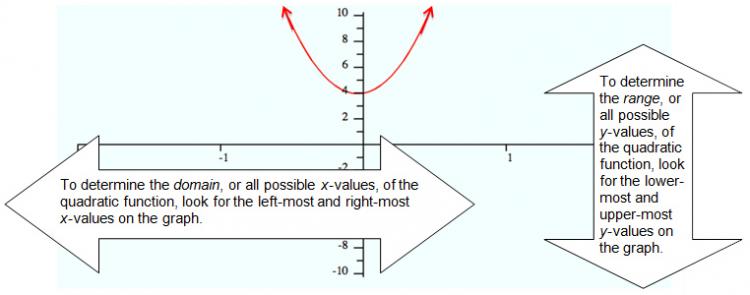
The graph of y = 25x2+ 4 is shown below. Determine the domain and range of this function. Drag the appropriate values into the boxes below the graph.
Practice Activity—Quadratic Function Explorer
1. Using the interactive link above, move the sliders to adjust the values of the coefficients: a, b, and c. Observe how the graph changes when you move these sliders.
2. Continue to adjust the values of the coefficients until the graph satisfies the domain and range values listed below. Record the function and its corresponding domain and range in your notes.
Domain: –∞ < x < ∞, Range: y ≥ 0
Domain: –∞ < x < ∞, Range: y ≤ -5
Domain: –∞ < x < ∞, Range: y ≥ 2
Investigating Domain and Range Using Verbal Descriptions
Sometimes you will be presented a problem in verbal form, rather than in symbolic form. In order to determine the domain and range of a quadratic function from the verbal statement it is often easier to use the verbal representation—or word problem—to generate a graph. By using this word problem, you can more conveniently find the domain and range from the graph.
Click on the image to access the video and follow the instructions:
- Watch the video. When asked to identify the true statement regarding the independent and dependent variable, choose A, B, or C.
- Record the example problem and the table of values for t and h.
- After the graph is drawn, identify the domain and range for the function, and record it in your notes. Estimate the maximum value of t for the domain.
Use your graphing calculator or an online graphing calculator for the following examples. Graph the functions to determine the domain and range of the quadratic function.
Example 4
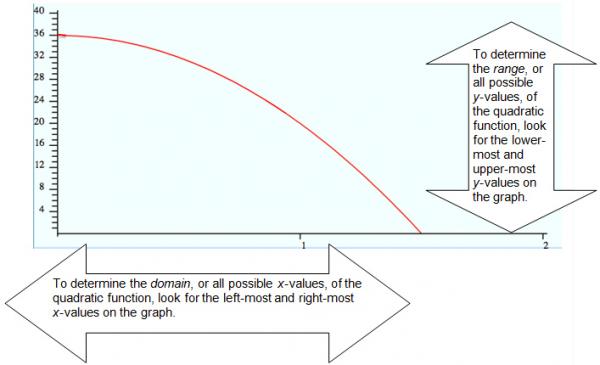
A bird is building a nest in a tree 36 feet above the ground. The bird drops a stick from the nest. The function f(x) = -16x2 + 36 describes the height of the stick in feet after x seconds. The graph of this function is shown below. Identify the domain and range of this function using the drag and drop activity below.
Example 5
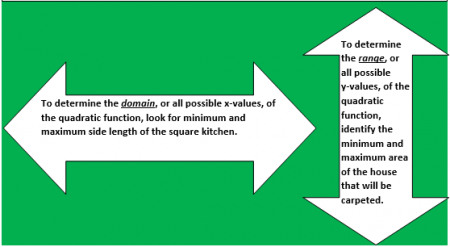
The DeWind family lives in a rectangular-shaped home with a length of 45 feet and a width of 35 feet. Mr. DeWind plans to install carpet in every room of the house, with the exception of the square kitchen. The kitchen has a side length of x feet. The function y = 1575 - x2 describes the area of the home in square feet, without the kitchen. Identify the domain and range of this function.
