Functions and Graphs—Discovery
The following tables, mappings, and sets are all examples of functions.
|
{(-2, -5), (2, 7), (5, 16), (6, 19)} | 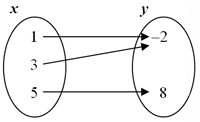 |
||||||||||||
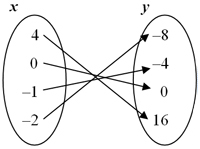 |
|
{(-3, -16), (1, 4), (2, 9), (3, 14)} |
Now that you have studied examples of functions, use your notes to describe the similarities and differences of functions that are represented in the forms of tables, mappings, and sets.
The Vertical Line Test
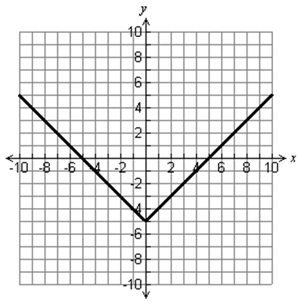
The following graphs are also examples of functions.
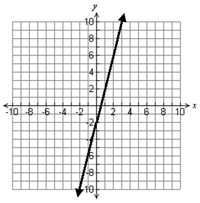

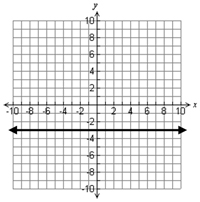
To determine whether or not a graph is a function, you can use the vertical line test. Watch the video below on how to use a vertical line test to determine if a graph is a function.
Functions and Relations—Discovery
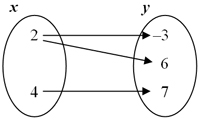
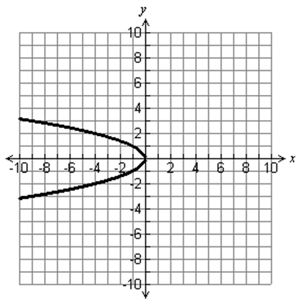
The following tables, mappings, sets, and graphs are all examples of relations that are not functions.
|
{(-3, -6), (2, 4), (5, 11), (2, 18)} | 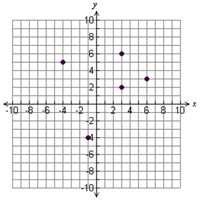 |
||||||||||||
 |
 |
{(-4, -12), (1, 3), (2, 6), (1, 14)} | ||||||||||||
 |
|
 |
Now that you have studied examples of relations that are not functions, use your notes to describe the similarities and differences of relations that are not functions.
Relations and Functions Overview
A relation is simply a set of ordered pairs. Not every relation is a functional relationship.
A function exists when each x-value (input, independent variable) is paired with exactly one y-value (output, dependent variable). This pairing is also referred to as a functional relationship.
Watch the video below to learn more about relations and functions.
Student Practice—Identifying Functions
Now that you have viewed the video, let’s practice identifying functions. Determine if the given table, graph, or mapping is a functional relationship. Then tell why or why not a functional relationship exists.
Use your notes to record your answers.
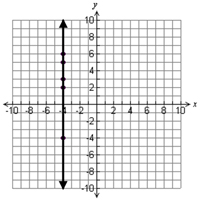
1. Does the graph below show a function?
2. Does the data in the set below represent a functional relationship?
{(2, 7), (5, 8), (6, 8), (2, 5)}
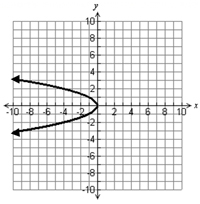
3. Does the graph below show a functional relationship?
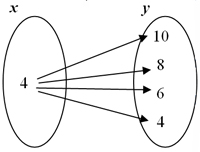
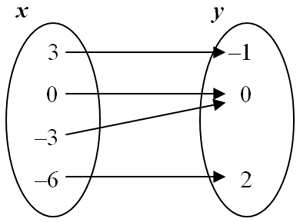
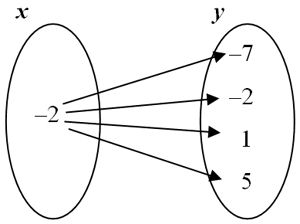
4. Does the mapping below represent a function?
5. Does the data in the table below represent a functional relationship?
|
|
|
|
|
|
|
|
|
|
|
|
|
|
|
|
|
|
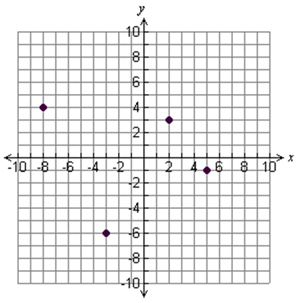
6. Mr. Pappas placed a coordinate grid over a map of the city. He used his office building as the origin of the coordinate grid. The points on the graph below represent locations of meetings that Mr. Pappas will be attending during the week. Does the graph represent a function?
7. Does the mapping below represent a functional relationship?
8. Lizzie was given the set of points shown below. Does the data in the set represent a functional relationship?
{(8, 7), (-7, 7), (-3, 7), (2, 7)}
Follow the link below and complete the activity for more practice.
Creating Your Function and Relation
Use your notes to create one example of a function and one example of a relation that is not a function. Explain why your examples are/are not functions.