Introduction
Slope is a constant rate of change for a linear function. You can use equations, graphs, and tables to represent the slope of a linear function, and you can use the slope formula to calculate the slope between two points.

In this resource, you will examine equations, tables, and graphs that all represent linear functions. You will use these representations to determine the slope of the linear function, and then use the slopes to make comparisons among linear functions.
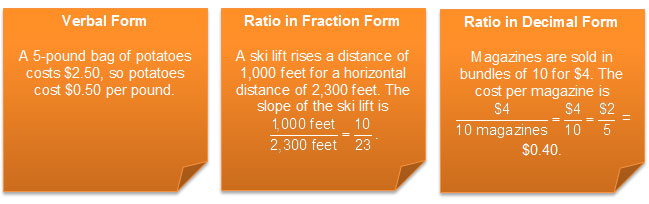
Remember, slope is a rate of change and can appear in a variety of ways.
Determine the Slope Given an Equation
Compare the two sets of equations below. One set is presented in slope-intercept form, and the other set is not.
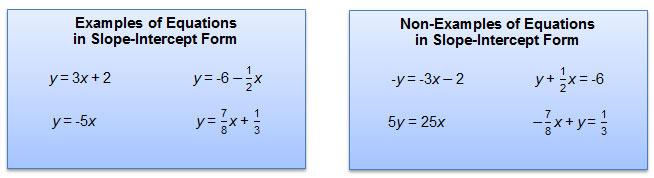
How can you tell if an equation is written in slope-intercept form?
One way to determine the slope of a line, given its equation, is to change the equation to slope-intercept form, and then identify the coefficient of the x term. The coefficient of the x term is the slope of the line.
To write an equation in slope-intercept form, you must solve the equation for y.
Directions:
- Copy the table below into your notes.
- Solve the equation for y, determine the slope, and then write your solutions in the table.
- Use the Equation Calculator and Solver below to check your answers. Click on the image to access the Equation Calculator and Solver.
- After you use the Equation Calculator and Solver, click on the link below to see a completed table.
| Equation | Equation in Slope-Intercept Form | Slope |
|---|---|---|
| -5x + y = 10 | ||
| 3y + 15x = 8 | ||
| -4 + 2y = 10 | ||
| 6y + 3x = 18 |
Equation Calculator and Solver
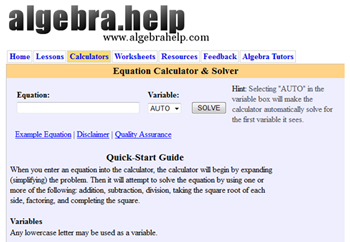
Need help using the Equation Solver? Click to see an image with additional directions.
Pause and Reflect
- List the slopes from your table in order from least to greatest.
- Which of the slopes are greater than −1?
Practice
Determine the slopes of the lines represented by each of the equations below.
- y = 0.45x – 18
- y = x – 18
- 5x + 8y = 38
- 3.2x + 1.6y = 72
Determine the Slope Given a Table
Let’s consider a situation where the Williams family is coming home from visiting relatives. Mrs. Williams has to drive 350 miles in order to get home. Even though there is road construction, the family still drives at a constant rate; however, it takes them longer to drive home than it did to get to their relatives' house. Shonda Williams was bored, so she kept track of how many miles, y, remained until they got home after a certain amount of time, x, had passed. Shonda’s data appears in the table below.
|
Return Trip Home
|
|
|
Amount of Time Since
Leaving Relatives (in hours), x |
Number of Miles Remaining, y
|
|
0.5
|
325
|
|
1
|
300
|
|
1½
|
275
|
|
2.5
|
225
|
|
4
|
150
|
Use the interactive below to help you determine the slope of the function representing the Williams family’s return trip home.
What is the slope of the linear function representing the relationship between the amount of time since leaving the Williams family’s relatives’ house, x, and the number of miles remaining, y, until the Williams family is back home?
Remember, slope can be found using the following formula:
Pause and Reflect
- If you select a different pair of numbers from the table, do you get a different value for the slope? Why do you think that is the case?
- How is this method related to the slope formula?
Determine the Slope Given a Graph
There are several methods you can use to determine the slope of a line when you are given its graph. In this section, you will study two different methods.
Method 1
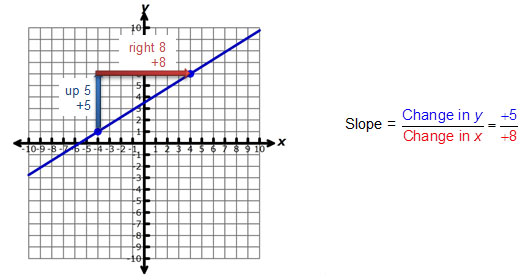
Choose two points from the line of the graph to determine the rise over run. View the videos below to learn more about this method.
Pause and Reflect
If you are using the rise over run method for determining the slope from a graph, how can you tell from looking at the line if the slope will be positive or negative?
Method 2
Choose two points from the line of the graph. Given the coordinates of those two points, use the slope formula to determine the slope.
View the video below to learn more about this method.
Pause and Reflect
How does using the slope formula compare to using the rise over run method?
Practice
Click on the image below to open a new website and practice determining the slope given a graph. Complete problems 1-10. Enter your answers into the box on the left. Check your answers once you are done.
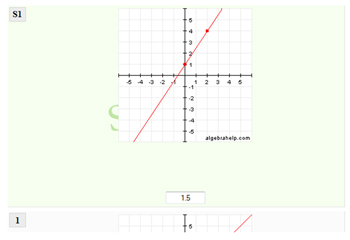
Source: Practice Problems- Determining Slope From a Graph, algebrahelp.com
Defining Zero Slope, No Slope, and Undefined Slope
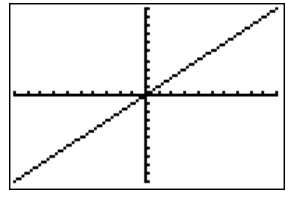
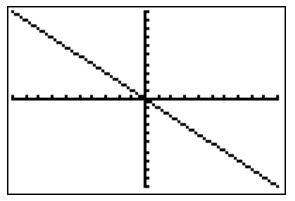
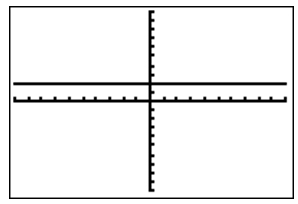
The slope of a line can be positive, negative, zero, or undefined. Below are graphical representations of a positive, negative, zero, and undefined slope.
|
Positive Slope
|
 |
|
Negative Slope
|
 |
|
Zero Slope
|
 |
|
Undefined Slope
|
 |
Deciphering the difference between zero, undefined, and no slopes lines can be difficult. Remember, mathematics is like learning another language.
Click on the chart below next to the given slope to translate each phrase. Use the slope and the translation to decide which is the correct real world example in the third column.
Summary
In this resource, you investigated different ways to determine the slope of a linear function. One of the most helpful ways to determine the slope is to use the slope formula.
If you are given a table or graph, the slope formula can indirectly be used by finding the ratio of the change in the y-values and the change in the x-values.
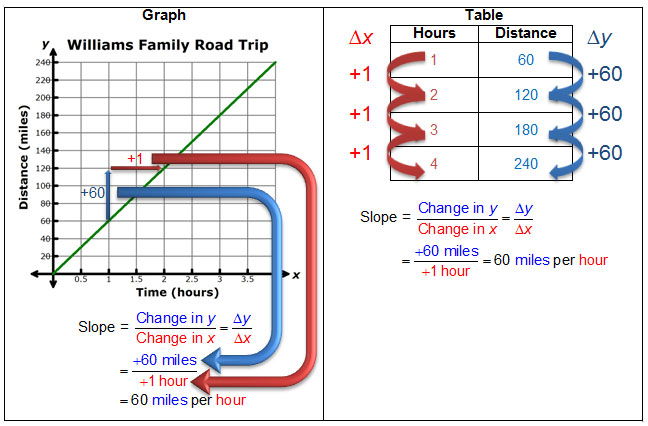 In a graph, the ratio of the change in y to the change in x is called rise over run. In a table, we can use the notation to represent this ratio, where Δ is the Greek letter delta, which is used to mean "change in" a quantity.