Introduction
When you are investigating the relationship between two variables, one of the attributes that you should look for is the rate of change.
Linear functions have a constant rate of change, and nonlinear functions have a changing rate of change.
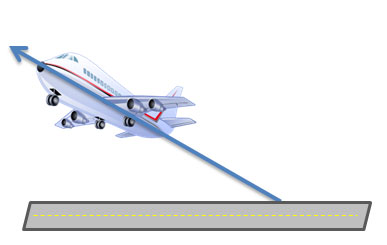
When an airplane takes off, it changes elevation at a certain number of feet per minute. If this change in elevation is constant, then the relationship between elevation and time since takeoff is a linear relationship.
Other relationships, such as the change in stock price over time, do not follow a constant rate of change. These relationships are nonlinear relationships.
In this resource, you will investigate special characteristics of rates of change of linear functions.
Defining Rate of Change
Rate of change is the ratio that describes how much one quantity changes in comparison to another quantity. Given an independent variable, x, and dependent variable, y, the rate of change is determined by dividing the change in y by the change in x.
View the video to learn more about rate of change.
Pause and Reflect
- What are some examples of real-world rates of change?
- How can a graph be used to represent a rate of change?
Multiple Representations of Rate of Change

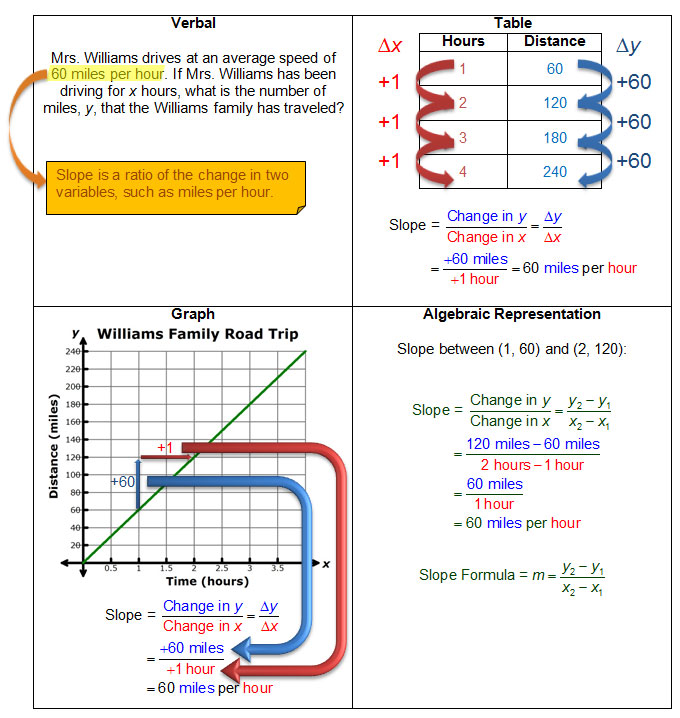
Rate of change may be represented in various forms. The Williams family is taking a road trip to visit relatives for the holidays. Mrs. Williams drives at an average speed of 60 miles per hour. If Mrs. Williams has been driving for x hours, what is the number of miles, y, that the Williams family has traveled?
Let’s represent this situation using a table, algebraic representation, and a graph.
Explore the interactive to see the different representations of this situation.
Pause and Reflect
In each representation, what similarities do you see in the changes in distance and changes in time?
Practice
The table below shows the distance and time for the Pennington's family road trip. Use the table to answer questions 1–3.
|
Pennington Family Road Trip
|
||||
| Time (hours) |
2
|
4
|
6
|
8
|
| Distance (miles) |
170
|
340
|
510
|
680
|
1. What is the rate of change in the table?
2. Describe the rate of change between the two variables.
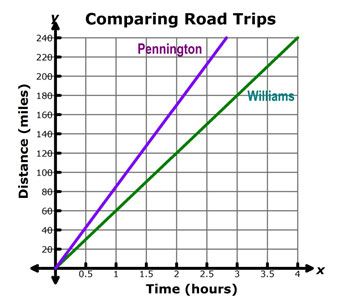
4. How does the rate of change for the Williams family road trip compare to the rate of change for the Pennington family road trip?
5. How do the graphs of the Williams family road trip and the Pennington family road trip compare?
Rate of Change and Slope
In the previous section, you compared graphs of two different families’ road trips. You discovered that the graph of the Pennington family road trip was steeper than the graph of the Williams family road trip because the rate of change for the Pennington family was greater than the rate of change for the Williams family.
Graphically, the rate of change represents the slope of a line. The slope of a line is the steepness of the graph. Therefore,
Complete the activity below to learn more about the rate of change as the slope of a line.
Pause and Reflect
- How can you tell if a line has an increasing slope?
- How can you tell if a line has a decreasing slope?
- How can you tell if a line has a slope of zero?
- How can you tell if a line has an undefined slope?
Slope of a Line
In the previous section, you learned the definition of slope to be as follows:
Graphically, the slope of a line can be represented using a change in the vertical direction and a change in the horizontal direction.
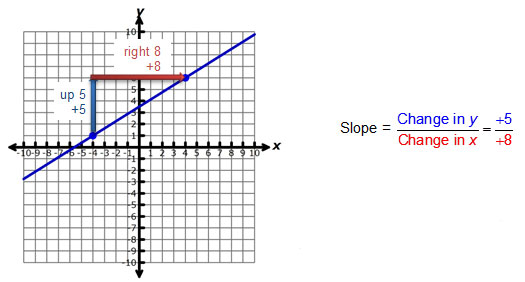
Given two points (x1, y1) and (x2, y2), the slope of a line can be determined using the formula below.
In the slope formula, y2 - y1 represents the change in y, while x2 – x1 represents the change in x. Let’s practice using the slope formula with the interactive below. Find the slope of the line connecting the points (-4, 7) and (-3, -1). Simplify the numerator and denominator in order to determine the change in the vertical direction and the change in the horizontal direction.
Up, Up, and Away
In previous sections of this resource, you learned that a rate of change for a linear function is also called the slope of the line for a linear function. However, in the real world, not all relationships are linear. In this section, you will investigate a situation that combines both linear and non-linear relationships – the height of a hot air balloon versus time.
Directions:
- Use this link to complete the activity.
- Check the Show Balloon/Animation Control and Visualize Average Rate of Change boxes located in the upper right hand corner.
- Click the Play button in the lower left hand corner of the applet to watch the balloon rise and fall.
Use the applet to answer the following questions.
- What is the average rate of change of the balloon’s height? Between 0 and 10 minutes? 10 and 20 minutes? (Hint: Move the red dots to the designated times. Look at the formula below the graph to determine your answer.)
- How would you describe the parts of the graph where the balloon is rising and falling?
Summary
In this resource, you investigated different representations of rates of change. For linear functions, the rate of change is called slope.
Whether you are given a verbal situation, table, graph, or algebraic representation, you can identify the slope from any of these situations.