Introduction
In previous grades, you learned how to use random samples to make inferences about a population.
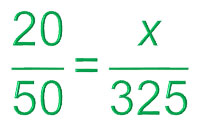
For example, suppose there are 325 eighth grade students at Sam Houston Middle School. A total of 50 eighth grade students were surveyed at random and 20 of those students said that they supported using clear backpacks for increased school safety. You can use this information to set up and solve a proportion to estimate how many of the 325 total eighth grade students would be likely to support using clear backpacks.
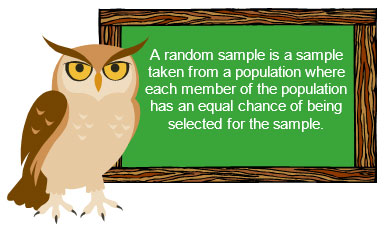
Before continuing in this lesson, it is important to understand two key terms about sampling.
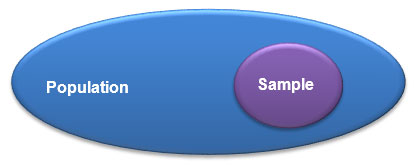
As the Venn diagram shows, the population is the entire group that is being studied. The most accurate way to describe the entire population is to study each member of the population, such as the way the United States census counts the nation’s population every 10 years. However, that is very expensive and takes a lot of time. Statisticians have shown that you can usually get good results by studying a random sample that is selected from within the population.
But how can you make sure that the sample really is random? How well does a randomly selected sample represent the population? In this lesson, you will use simulations to investigate these questions.
Comparing Random Samples from a Population
In previous grades, you used data from a random sample to make inferences and draw conclusions about a population. In this section, you will investigate different simulations that could be used to generate a random sample.
Consider the following problem.
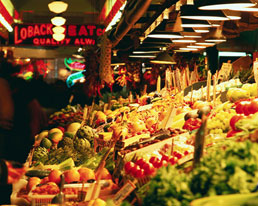
There are 100 pieces of fruit in Sidney’s Fruit Stand. Of those, there are 20 packages of blueberries, 40 pears, 25 apples, and 15 pineapples.
You can use color tiles to represent the fruit at Sidney’s Fruit Stand.
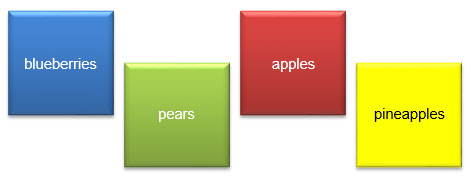
- Use 20 blue tiles to represent the blueberries.
- Use 40 green tiles to represent the pears.
- Use 25 red tiles to represent the apples.
- Use 15 yellow tiles to represent the pineapples.
In the color tile simulation, you can place 100 color tiles in a bag and randomly select 20 of them. Each color tile selected would represent one fruit, and you could record the results.
Another simulation could use a random number generator to select 20 random numbers between one and one hundred.
- Let 1 to 20 (20 total numbers) represent the blueberries.
- Let 21 to 60 (40 total numbers) represent the pears.
- Let 61 to 85 (25 total numbers) represent the apples.
- Let 86 to 100 (15 total numbers) represent the pineapples.
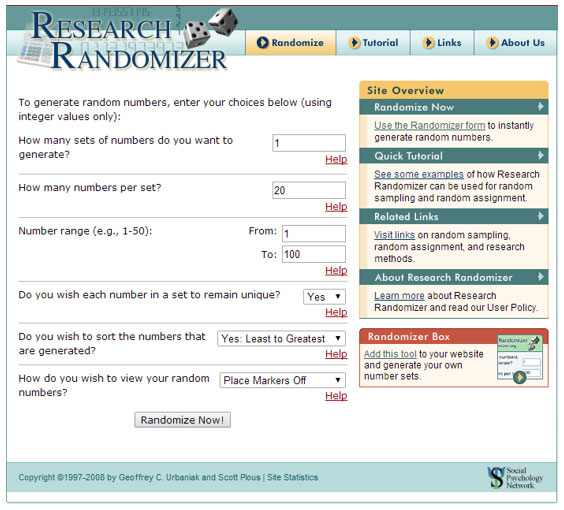
Click the image below to use a random number generator to simulate the random sample. Enter the appropriate numbers in the boxes, then click Randomize Now! to generate the set of 20 random numbers.
- How many sets of numbers do you want to generate? 1
- How many numbers per set? 20
- Number range: From 1 to 100
- Do you wish each number in a set to remain unique? Yes
- Do you wish to sort the numbers that are generated? Yes: Least to Greatest
1. For your set of random numbers, match each number with the fruit that it represents.
Remember the following:
- Let 1 to 20 (20 total numbers) represent the blueberries.
- Let 21 to 60 (40 total numbers) represent the pears.
- Let 61 to 85 (25 total numbers) represent the apples.
- Let 86 to 100 (15 total numbers) represent the pineapples.
2. For your set of random numbers, how many of each type of fruit are represented?
3. For your set of random numbers, what percentage of the sample is each fruit? How does that compare to the known distribution of fruit in the population (the entire fruit stand)?
Pause and Reflect
- How do the characteristics of the random sample compare to the characteristics of the population?
- If you increased the size of the sample, how do you think that would affect the relationship between the characteristics of the random sample and the characteristics of the population?
Practice
Describe a simulation that could be used for each of the following situations.
- A coin collection has 175 coins – 50 pennies, 75 nickels, 20 dimes, and 30 quarters. Create a random sample of 40 coins.
- A volleyball league has 90 jerseys. Twenty-five of the jerseys are blue, 15 are purple, 30 are black, and 20 are red. Create a random sample of 25 jerseys.
Comparing Samples from a Population
In the last section, you used color tiles and a random number generator to simulate creating a random sample from a population. In this section, you will compare more than one random sample that is taken from the same population in order to look for patterns.
Revisit the problem from the previous section.
As before, use a random number generator to create a simulation. However, this time, generate three sets of random numbers.
- Let 1 to 20 (20 total numbers) represent the blueberries.
- Let 21 to 60 (40 total numbers) represent the pears.
- Let 61 to 85 (25 total numbers) represent the apples.
- Let 86 to 100 (15 total numbers) represent the pineapples.
Click the image below to use a random number generator to simulate the random sample. Enter the appropriate numbers in the boxes, then click Randomize Now! to generate the set of 20 random numbers.
- How many sets of numbers do you want to generate? 3
- How many numbers per set? 20
- Number range: From 1 to 100
- Do you wish each number in a set to remain unique? Yes
- Do you wish to sort the numbers that are generated? Yes: Least to Greatest

1. For your set of random numbers, how many of each type of fruit are represented in each set?
Remember the following:
- Let 1 to 20 (20 total numbers) represent the blueberries.
- Let 21 to 60 (40 total numbers) represent the pears.
- Let 61 to 85 (25 total numbers) represent the apples.
- Let 86 to 100 (15 total numbers) represent the pineapples.
2. For your set of random numbers, what percentage of each sample is each fruit? How does that compare to the known distribution of fruit in the population (the entire fruit stand)?
Pause and Reflect
You generated several random samples of the same size from a population with known characteristics. In general, how does the random sample compare to the population from which it was selected?
Practice
- A coin collection has 250 coins – 75 pennies, 100 nickels, 25 dimes, and 50 quarters. What would you expect a random sample of 50 coins from this collection to look like?
- In a recent election, Candidate A received 110 votes, Candidate B received 70 votes, and Candidate C received 120 votes. A pollster interviewed 50 randomly selected voters as they were leaving the polls. What would you expect the pollster’s results to be?
Summary
In this lesson, you used simulations to generate random samples of the same size from a population with known characteristics. With several random samples from the same population, you observed that a random sample is typically representative of the population from which it was selected.

Random samples are useful in predicting election results or describing how particular groups of people voted in an election.