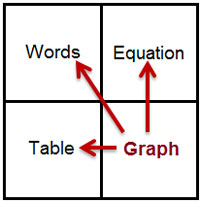
Multiple Representations of Data
Mathematical relationships and data can be presented in several different forms.
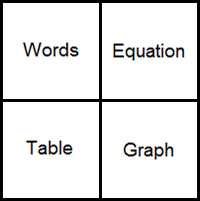
Explore each statement below.
In this lesson, we will take a closer look at how data is presented in each one of these forms and how to rework data from one form into another.
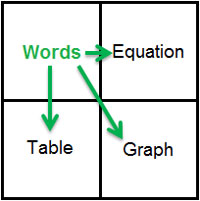
Starting with a Verbal Description
When writing an equation from a verbal description or word problem, you need to look for clue words and phrases that tell you which operations you should use.
Words such as "and," "together," and "total" suggest that you will need to use addition. Words and phrases such as "product," "times," and "increase by a factor of" indicate that you should use multiplication.
Click on each mathematical symbol for a list of words or phrases you may see in a problem that tell you to use that operation.
Consider the following situation:
Marta and her family are staying at a campground that charges a non-refundable $15.00 security deposit plus $30.00 for each day that her family stays.
- What clue words suggesting operations does the problem use?
- Write a plan for solving this problem.
- Write this plan as an equation that could be solved for y, the cost of staying at the campground for x days.
- Copy the following table into your notes and use your solution plan to fill in the missing information.
| Number of days (x) |
Process | Cost (y) |
| 2 | 15 + 30(2) | $75.00 |
| 3 | ||
| 4 | ||
| 5 | ||
| x |
5. How did you fill in the y column?
When creating a graph from a verbal description, it is usually best to make a table of values first. Because of this, we will cover the specific concepts of graphing data in more depth in section 3. In this section, we will concentrate on the general properties of the graph of the data.
- If Marta's family pays the security deposit, and then due to a change in plans ends up staying 0 nights, how much will they have paid in total?
- Is the cost increasing or decreasing as the number of days increases?
- If you were to graph this data, would you expect the graph to rise or fall as you move to higher x values? Why?
- In general, how would you describe the graph of the data associated with this problem?

Darius earned a total of $800 mowing lawns over the summer. He wants to buy video games that cost $25.00 each. How can you determine y, the amount of money he will have left if he buys x video games?
5. Write a plan that you could use to solve this problem.
6. Copy the following table into your notes and use your solution plan to fill in the missing information.
| Number of games (x) |
Process | Remaining money (y) |
| 2 | 800 – 25(2) | $750.00 |
| 3 | ||
| 4 | ||
| 5 | ||
| x |
7. Write your plan as an equation.
8. What would you expect the graph of this data to look like? Why?
Starting with a Table
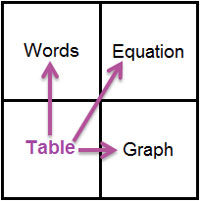
In this section we will look at ways to work with a data table.
Isidro is playing a "guess the rule" game on the computer. He types in a number, and the computer gives a number in response. The program generates the following data set:
| x | y |
| -6 | 8 |
| -3 | 6 |
| 0 | 4 |
| 3 | 2 |
| 6 | 0 |
- What is the change in the y-values from one row to the next row?
- What is the change in the x-values from one row to the next row?
- What is the ratio of the changes in y-values to the changes in x-values?
- How does the value of y change as the value of x increases?
- Does the value of y decrease at a constant rate or at a variable rate?
- How much would the value of y change if the value of x changed by 1?
- To calculate the value of y would you multiply the value of x by or add to the value of x?
- What is the value of y when the value of x is 0?
- Use the answer to the previous question to write a new sentence that describes how the value of y relates to the value of x.
- Write your sentence as a mathematical equation.
Click here if you need a review of plotting points on an axis.
Click here to open a printable sheet of coordinate planes you can use to make draw graphs.
Graph the data from the table on one of the coordinate planes on the sheet you just printed.
| x | y |
| -6 | 8 |
| -3 | 6 |
| 0 | 4 |
| 3 | 2 |
| 6 | 0 |
If you need help graphing the points from the table above, you can use this plotting applet.
Click here for applet instructions. As you enter data, click the Plot/Update button after each ordered pair to see the data point appear on the graph.
Click here to see the completed graph.
If you are drawing a graph to show only the data in the table, you plot individual points on the graph. If you are drawing a graph to represent the relationship between x and y that is shown by your data, then you connect the points with a line that continues on in either direction.
Write a verbal description and an equation, and draw a graph that each represent the relationship shown in the following data tables.
Starting with an Equation
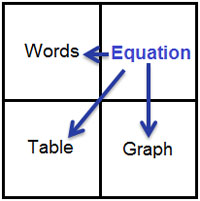
Given an equation, you can generate a graph, fill in values for a table, and write a description.

Sydney finds that the data from her science experiment can be represented by the equation listed below.
y = 3x – 1
Answer the following questions to write a verbal description for the equation.
- If you are given a value for x, what two steps do you need to follow to calculate a value for y?
- Re-write your answer to the previous question in one complete sentence. (It is often helpful to start with the phrase, "The value of y is . . .")
Use the following questions to help you fill in the table below.
- Calculate the value for y if x = -2
- Calculate the value for y if x = -1
- Calculate the value for y if x = 0
- Calculate the value for y if x = 1
- Calculate the value for y if x = 2
Copy the following table into your notes and based on your answers to the previous questions, fill in the missing values.
| x | process | y |
| -2 | ||
| -1 | ||
| 0 | ||
| 1 | ||
| 2 |
Click here to see the completed table.
Now that you have a table of values, use what you learned in section 3 to draw a graph of the relationship.
Click here to see a completed graph.
Create a verbal description, a table, and a graph to represent the relationship shown in the following equation.
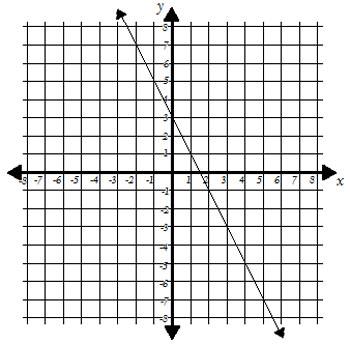
Starting with a Graph
Use the graph below to complete the interactive exercise.
Create a data table and write a verbal description and an equation that model the relationship shown in the following graph.
Review
Click in a square to see how to convert from one representation to another.
Match pairs that are representations of the same relationship.