Introduction
When you use mathematics to model real world situations, you will frequently encounter rates of change.
Some rates of change are constant.
Other rates of change are not constant.
In this lesson, you will investigate different ways to represent relationships with a constant rate of change. You will learn how to graph those relationships, and how to interpret constant rates of change that are represented in graphs.
Graphing Data
Graphing ordered pairs on a coordinate plane is a very important way to visually represent the relationship between the two variables of a data set.
Use the interactive to practice plotting ordered pairs of rational numbers.
Consider the following questions in the interactive.
Which coordinate corresponds with the horizontal axis (x-axis), the first or second coordinate?
Which coordinate corresponds with the vertical axis (y-axis), the first or second coordinate?
What does the sign of the coordinate tell you about the direction of the point from the origin?
Pause and Reflect
Data sets are sometimes presented in tabular form instead of ordered pairs.
|
x
|
4
|
-2.1
|
7.8
|
0
|
|
y
|
1
|
5
|
-3
|
4
|
How would you graph the points represented by the data in the table?
Scale Factors and Rates of Change
In this section, you will investigate scale factors and how they relate to rates of change. You will also represent rates of changes in tables and graphs, and look for patterns.
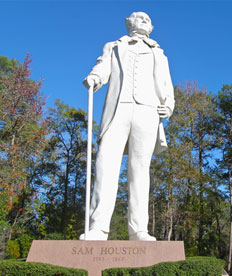
In 1994, A Tribute to Courage, a 67-foot tall statue of Sam Houston, was dedicated just south of Huntsville, Texas. The statue was built to honor the first president of the Republic of Texas, and the namesake of Texas’s largest city, Houston.
In real life, Sam Houston was 6 feet, 6 inches, or 6.5 feet, tall. The statue is a scaled version of what we know about how Sam Houston looked from pictures and other historical artifacts.
Use the interactive below to determine the actual dimensions of Sam Houston based on what can be measured from the statue. Use the scale factor to determine the actual dimensions from the dimensions of the statue.
Source: Sam Houston, 1793-1863, Roy Luck, Flickr
Let’s represent this information in a table, and look more closely at the rate of change in the table.
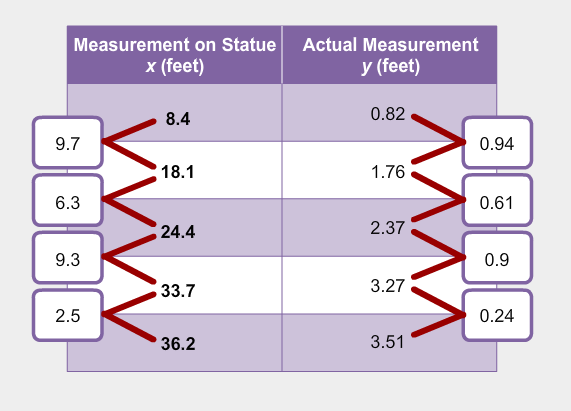
Use the table to answer the questions that follow.
- The table shows the differences in successive x-values and successive y-values. Calculate the ratio of each pair of differences. For example, for the first row, the ratio is ≈ 0.097. You may use an online calculator to help you with the computation.
- What do you notice about the ratios of each pair of differences?
- Would you say that the data in the table has a constant rate of change, or a non-constant rate of change?
- How does the rate of change in the table compare to the scale factor used that relates the dimensions of the actual measurements to the dimensions of the statue?
Now that you have the dimensions of parts of both the statue and the actual measurements for Sam Houston, you can represent those number pairs as points on a coordinate plane.
In the interactive activity, drag the dot for each ordered pair to the correct location on the coordinate plane.
Click here to see the trend line that represents the best place to connect most of the points.
Use the information from the interactive to answer the following questions.
How does the rate of change in the graph compare with the scale factor used to relate the dimensions of Sam Houston to that of his statue?
Pause and Reflect
For data with a constant rate of change, how does the scale factor relate to the rate of change in a table or a graph?
Practice
 A replica of the Statue of Liberty is on the grounds of the state capitol in Austin, Texas. The replica has a height of approximately 5 meters, and the actual Statue of Liberty in New York, New York, has a height of approximately 45 meters.
Source: Statue of Liberty Frontal 2, Daniel Schwen, Wikimedia Commons
Interpreting Rates of Change from Graphs
In previous sections, you looked at different ways to represent rates of change using tables and graphs. In this section, you will focus on interpreting the rate of change from a graph.
Pause and Reflect
How can you use points on the graph to help you interpret the rate of change?
For proportional situations, how does the rate of change in the graph relate to the situation being described?
Summary
You used tables and graphs to show how to represent situations with a constant rate of change, such as those involving scaling.
For example, suppose a scale model is built using a scale of inch to 4 feet. You can use this scale to build a table of values.
| Scaled Dimensions |
0.25 inch | 0.5 inch | 1 inch | 1.5 inches | 2 inches |
| Original Dimensions |
4 feet | 8 feet | 16 feet | 24 feet | 32 feet |
Once you have a table of values, you can build a graph.
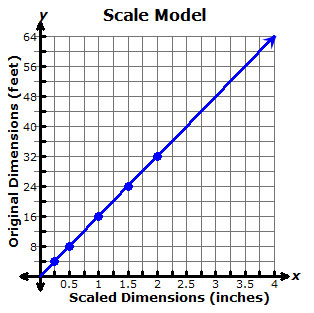
From the graph, you can then identify additional values that match the same scale.