Introduction
A proportion is an equation stating that two ratios are equivalent. A relationship that involves a collection of equivalent ratios is called a proportional situation.
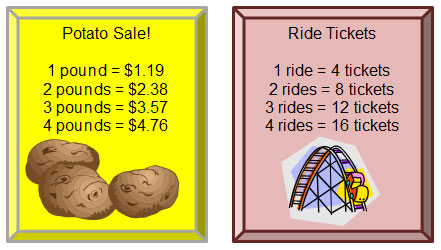
In each of these situations, you can see that the relationships are proportional. For each of the data points, the ratios are equivalent.
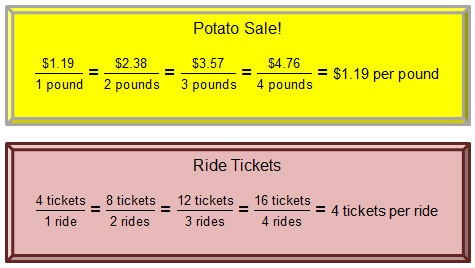
A rate is a comparison between two quantities. When the denominator of the rate is one, it is called a unit rate.
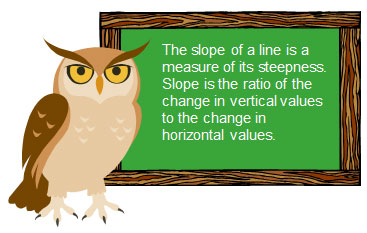
In this lesson, you will extend what you know about unit rates and look for patterns in graphs of proportional relationships. You will also investigate slope, which is a special characteristic of linear relationships. In a linear relationship, the slope of the line is steepness of the graph of the line. Slope is also described as the ratio of the vertical change to the horizontal change between two points on the line.
Graphing Ordered Pairs of Data
In this section, you will review graphing ordered pairs of points that represent data from a proportional relationship.
Graphing ordered pairs on a coordinate plane is an important way to visually represent the relationship between the two variables in a set of data.
To practice graphing ordered pairs of data, consider the situation below.
Melanie works as a courier. She made a chart of the distances that she drove one day and the time that it took her to drive each distance.
|
Distance (miles)
|
Time (hours)
|
|
20
|
0.5
|
|
40
|
1
|
|
45
|
1.125
|
|
50
|
1.25
|
|
30
|
0.75
|
|
10
|
0.25
|
Use the graph to answer the questions below.
- How do the points on the graph compare to the line?
- Does the line pass through the point (0, 0)? What would this ordered pair represent in the context of Melanie’s situation?
- How many miles did Melanie drive in 1 hour?
- What is the unit rate for this situation?
Pause and Reflect
How can you identify the unit rate from the graph of a proportional situation?
Practice
- Rachel recorded the number of pages that she read in particular amounts of time. Graph the data from the table below. Use an online graphing tool or graph paper.
Number of Hours, x 0.511.53Number of pages, y 306090180 - For the data in question 1, what is the unit rate, in pages per hour, at which Rachel can read?
Comparing Unit Rates and Slopes
In the last section, you practiced plotting points that represent data for a proportional situation. In this section, you will use graphs of data from proportional situations in order to compare the unit rate from the data with the slope of the line.
Use the interactive above to answer the questions that follow.
- In a proportional situation, how can you calculate the unit rate from a graph?
- How does the unit rate of the data compare to the slope of the line connecting the data?
Pause and Reflect
The slope of a line, m, can be represented as the ratio of a vertical distance to a horizontal distance between two points. The line representing a proportional relationship always contains the origin, (0, 0). If one other point is (1, a), why is the slope the same as the unit rate represented by the origin and the point (1, a)?
Practice
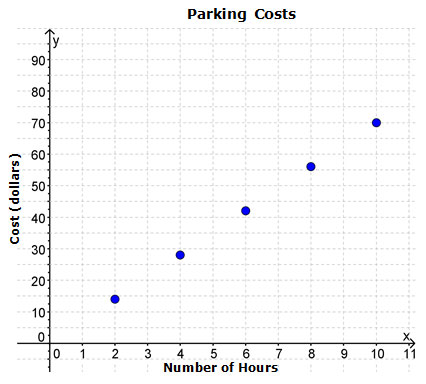
For each data set graphed below, identify the slope of the line that best models the data.
")
Summary
In this lesson, you applied what you have previously learned about unit rates to the concept of slope. For a proportional situation, the unit rate is the same as the slope of the line that represents the proportional data.
In the figure below, the graph shows the cost of avocados.
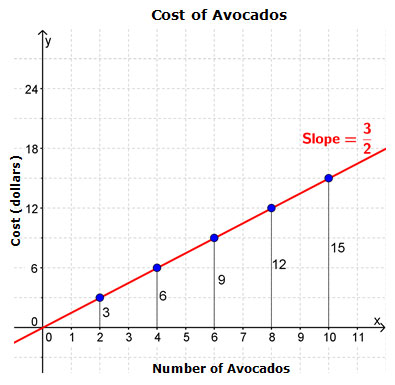
The unit rate from the data is $1.50 per avocado, which is the same as the slope of the line connecting the data points, .