Test Prep
Multiple Choice
2.1 Relative Motion, Distance, and Displacement
- a description of motion depends on the reference frame
- motion appears the same in all reference frames
- reference frames affect the motion of an object
- you can see motion better from certain reference frames
- It is always equal to the distance the object moved between its initial and final positions.
- It is both the straight line distance the object moved as well as the direction of its motion.
- It is the direction the object moved between its initial and final positions.
- It is the straight line distance the object moved between its initial and final positions.
- 130 miles
- 30 miles east
- 30 miles west
- Cannot be determined from the information given
- Yes, there is a single, correct frame of reference because motion is a relative term.
- Yes, there is a single, correct frame of reference which is in terms of Earth’s position.
- No, there is not a single, correct frame of reference because motion is a relative term.
- No, there is not a single, correct frame of reference because motion is independent of frame of reference.
If a space shuttle orbits Earth once, what is the shuttle’s distance traveled and displacement?
- Distance and displacement both are zero.
- Distance is circumference of the circular orbit while displacement is zero.
- Distance is zero while the displacement is circumference of the circular orbit.
- Distance and displacement both are equal to circumference of the circular orbit.
2.2 Speed and Velocity
- Cyclist 1 travels in .
- Cyclist 2 travels in .
- Cyclist 3 travels in .
- Cyclist 4 travels in .
A car travels with an average velocity of 23 m/s for 82 s. Which of the following could NOT have been the car’s displacement?
- 1,700 m east
- 1,900 m west
- 1,600 m north
- 1,500 m south
- Average velocity is zero.
- The magnitude of average velocity is equal to the average speed.
- The magnitude of average velocity is greater than the average speed.
- The magnitude of average velocity is less than the average speed.
2.3 Position vs. Time Graphs
- Velocity
- Displacement
- Distance
- Acceleration
2.4 Velocity vs. Time Graphs
- acceleration
- displacement
- distance
- instantaneous velocity
- cannot be determined from the information given
Short Answer
2.1 Relative Motion, Distance, and Displacement
While standing on a sidewalk facing the road, you see a bicyclist passing by toward your right. In the reference frame of the bicyclist, in which direction are you moving?
- in the same direction of motion as the bicyclist
- in the direction opposite the motion of the bicyclist
- stationary with respect to the bicyclist
- in the direction of velocity of the bicyclist
- Displacement of the ball is twice the length of the lane, while the distance is zero.
- Displacement of the ball is zero, while the distance is twice the length of the lane.
- Both the displacement and distance for the ball are equal to zero.
- Both the displacement and distance for the ball are twice the length of the lane.
- The distance is with a displacement of zero.
- The distance is with a displacement of zero.
- The distance is with a displacement of .
- The distance is with a displacement of .
2.2 Speed and Velocity
- 3t
- 6t
What can you infer from the statement, Velocity of an object is zero?
- Object is in linear motion with constant velocity.
- Object is moving at a constant speed.
- Object is either at rest or it returns to the initial point.
- Object is moving in a straight line without changing its direction.
- Reduce the distance that the object travels by half, keeping the time constant, or keep the distance constant and double the time.
- Double the distance that the object travels, keeping the time constant, or keep the distance constant and reduce the time by half.
- Reduce the distance that the object travels to one-fourth, keeping the time constant, or keep the distance constant and increase the time by fourfold.
- Increase the distance by fourfold, keeping the time constant, or keep the distance constant and reduce the time by one-fourth.
- His average velocity is zero because his total distance is zero.
- His average velocity is zero because his total displacement is zero.
- His average velocity is zero because the number of laps completed is an odd number.
- His average velocity is zero because the velocity of each successive lap is equal and opposite.
2.3 Position vs. Time Graphs
A hockey puck is shot down the arena in a straight line. Assume it does not slow until it is stopped by an opposing player who sends it back in the direction it came. The players are 20 m apart and it takes 1 s for the puck to go there and back. Which of the following describes the graph of the displacement over time? Consider the initial direction of the puck to be positive.
- The graph is an upward opening V.
- The graph is a downward opening V.
- The graph is an upward opening U.
- The graph is downward opening U.
A defensive player kicks a soccer ball 20 m back to her own goalie. It stops just as it reaches her. She sends it back to the player. Without knowing the time it takes, draw a rough sketch of the displacement over time. Does this graph look similar to the graph of the hockey puck from the previous question?
- Yes, the graph is similar to the graph of the hockey puck.
- No, the graph is not similar to the graph of the hockey puck.
- The graphs cannot be compared without knowing the time the soccer ball was rolling.
What are the net displacement, total distance traveled, and total average velocity in the previous two problems?
- net displacement = 0 m, total distance = 20 m, total average velocity = 20 m/s
- net displacement = 0 m, total distance = 40 m, total average velocity = 20 m/s
- net displacement = 0 m, total distance = 20 m, total average velocity = 0 m/s
- net displacement = 0 m, total distance = 40 m, total average velocity = 0 m/s
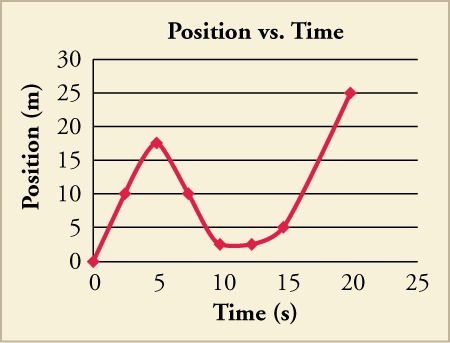
- The graph will look like a downward opening V shape.
- The graph will look like an upward opening V shape.
- The graph will look like a downward opening parabola.
- The graph will look like an upward opening parabola.
2.4 Velocity vs. Time Graphs

- It is a straight line with negative slope.
- It is a straight line with positive slope.
- It is a horizontal line at some negative value.
- It is a horizontal line at some positive value.
- The object is not speeding up, and the acceleration vs. time graph is a horizontal line at some negative value.
- The object is not speeding up, and the acceleration vs. time graph is a horizontal line at some positive value.
- The object is speeding up, and the acceleration vs. time graph is a horizontal line at some negative value.
- The object is speeding up, and the acceleration vs. time graph is a horizontal line at some positive value.

- 540 m
- 2,520 m
- 2,790 m
- 5,040 m
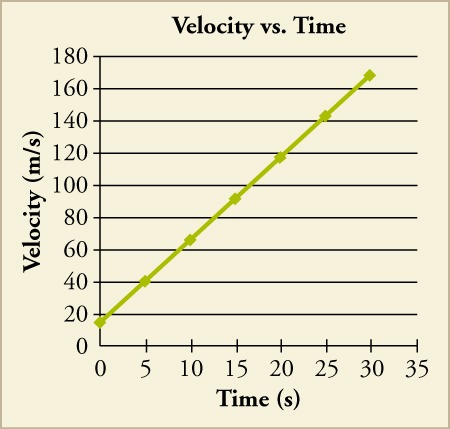
- 18 m/s
- 84 m/s
- 93 m/s
- 168 m/s
Extended Response
2.1 Relative Motion, Distance, and Displacement

Which path has the maximum distance?
- The distance for Path A is 6 m, Path B is 4 m, Path C is 12 m and for Path D is 7 m. The net displacement for Path A is 7 m, Path B is –4m, Path C is 8 m and for Path D is –5m. Path C has maximum distance and it is equal to 12 meters.
- The distance for Path A is 6 m, Path B is 4 m, Path C is 8 m and for Path D is 7 m. The net displacement for Path A is 6 m, Path B is –4m, Path C is 12 m and for Path D is –5 m. Path A has maximum distance and it is equal to 6 meters.
- The distance for Path A is 6 m, Path B is 4 m, Path C is 12 m and for Path D is 7 m. The net displacement for Path A is 6 m, Path B is –4 m, Path C is 8 m and for Path D is –5 m. Path C has maximum distance and it is equal to 12 meters.
- The distance for Path A is 6 m, Path B is –4 m, Path C is 12 m and for Path D is –5 m. The net displacement for Path A is 7 m, Path B is 4 m, Path C is 8 m and for Path D is 7 m. Path A has maximum distance and it is equal to 6 m.
- Displacement is 0 km and distance is 7 km.
- Displacement is 0 km and distance is 3.5 km.
- Displacement is 7 km towards west and distance is 7 km.
- Displacement is 3.5 km towards east and distance is 3.5 km.
2.2 Speed and Velocity
- Runner A will be m away and Runner B will be m away from the starting point.
- Runner A will be m away and runner B will be m away from the starting point.
- Runner A will be away and Runner B will be away from the starting point.
- Runner A will be away and Runner B will be away from the starting point.
A father and his daughter go to the bus stop that is located 75 m from their front door. The father walks in a straight line while his daughter runs along a varied path. Despite the different paths, they both end up at the bus stop at the same time. The father’s average speed is 2.2 m/s, and his daughter’s average speed is 3.5 m/s. (a) How long does it take the father and daughter to reach the bus stop? (b) What was the daughter’s total distance traveled? (c) If the daughter maintained her same average speed and traveled in a straight line like her father, how far beyond the bus stop would she have traveled?
- (a) 21.43 s (b) 75 m (c) 0 m
- (a) 21.43 s (b) 119 m (c) 44 m
- (a) 34 s (b) 75 m (c) 0 m
- (a) 34 s (b) 119 m (c) 44 m
2.3 Position vs. Time Graphs

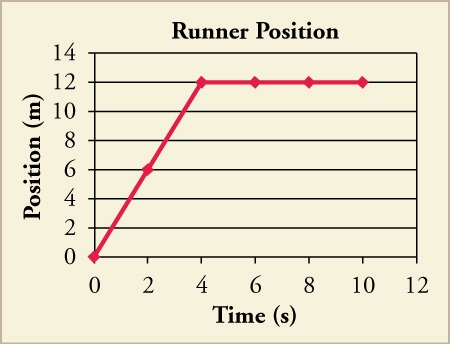
- uniform motion
- any motion that accelerates
- motion that stops and then starts
- motion that has constant velocity

2.4 Velocity vs. Time Graphs

During which points is the object slowing down and speeding up?
- It is slowing down between d and e. It is speeding up between a and d and e and h
- It is slowing down between a and d and e and h. It is speeding up between d and e and then after i.
- It is slowing down between d and e and then after h. It is speeding up between a and d and e and h.
- It is slowing down between a and d and e and h. It is speeding up between d and e and then after i.
- Acceleration is zero and average velocity is .
- Acceleration is constant with some positive value and average velocity is .
- Acceleration is zero and average velocity is .
- Acceleration is constant with some positive value and average velocity is .