Let's Get Started
TEKS Standards and Student Expectations
A(12) Number and algebraic methods. The student applies the mathematical process standards and algebraic methods to write, solve, analyze, and evaluate equations, relations, and functions. The student is expected to:
A(12)(D) write a formula for the nth term of arithmetic and geometric sequences, given the value of several of their terms
Resource Objective(s)
Given a pictorial or tabular representation of a pattern and the value of several of their terms, the student will write a formula for the nth term of a sequence.
Essential Questions
What strategies can be used to think about how to organize data?
How is a geometric sequence different from an arithmetic sequence?
Vocabulary
- Expression
- Additive Relationship
- Multiplicative Relationship
Writing Algebraic Expressions
Let's examine how to write an algebraic expression that describes a pictorial or tabular representation of a pattern.
A team of tile floor installers are creating the following pattern using very expensive marble tiles. They start in the center of a square room and work their way out until they hit a wall.

It would not be hard for them to count the number of tiles needed for a room in a house, but what if this was a pattern outside a large new sports arena? It will be very costly if they order too few tiles since it will delay the work. It will be very costly to order too many because there is a restocking fee if they return the expensive tiles. They need to get this order as close as possible. Our goal will be to write an expression that will let us know how many tiles will be needed for any sized pattern.
Organization is the key here. Make a table to plan drawing out the pattern of tiles. You'll need to decide on the things you're comparing, and the independent variable and dependent variable.
You may have wanted to label the columns slightly differently. "Number of Tiles" is a more precise label than just "Tiles."
The number of tiles in each drawing depends on which drawing of the pattern you are using, so the number of tiles is the dependent variable. We put the independent variable in the left column and the dependent variable in the right column.
Think about how many tiles would be in the fourth and fifth iterations of the drawings of the pattern. An expanded table is below.
We're still organizing our data. The next thing you may want to do is graph the points. Think about how a graph of these points might look.
|
The graphed data looks like a line. You have learned slope-intercept form before: y = mx + b.
Using the Graphing Calculator to Verify Algebraic Expressions
You will need your graphing calculator for this section of the resource. If you don't have a graphing calculator you can use a free online one by clicking here.
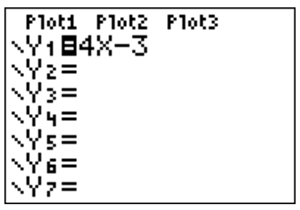
Using your calculator, follow the steps below to be sure that the expression 4x – 3 correctly describes the tile pattern.
|
Step 1: Enter the expression into your calculator, creating the equation y = 4x – 3. |
 |
||||||||||||
|
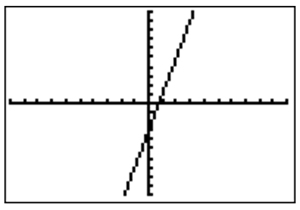
Step 2: Graph the equation. Be sure to set the window values. |
 |
||||||||||||
|
Step 3: Compare your calculator graph to the graph you previously created. They should match. The window is different so be careful. |
|||||||||||||
|
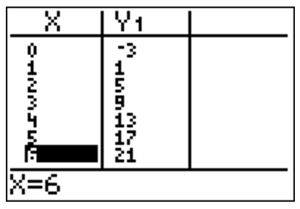
Step 4: Use the table feature on your calculator to display a table where the x-values range from 0 to 6. Decide if your calculator table matches the table you previously created. |
 |
||||||||||||
|
The calculator table matches the original table perfectly. It's okay that the table you made is missing (0, -3) and (6, 21). The important thing is that the five rows in your original table match the calculator table. Since the tables and graphs all match, it confirms that the installers can use the equation y = 4x – 3 (or the expression 4x – 3), to determine how many tiles they need, depending on the drawing number. |
|
Sample Problem: Brick Wall
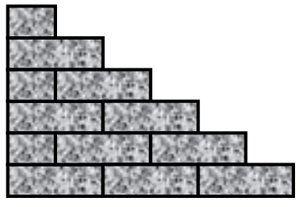
I don't know how many brick walls you've constructed, but to increase stability a bricklayer will alternate each row by starting that row with half a brick. Below is a drawing of a triangular wall that is six rows high.
Question
What expression describes how many bricks a bricklayer would need to build a triangular wall n rows high?
Follow the steps below to help solve this problem.
- Create a table.
- Draw a graph.
- Write an expression.
- Check
Now we can fill in the table. It will be easier if we break down the picture. Determine how many bricks are in each drawing. Scroll down to see the table.
| Explanation You may think that in a 1-row wall, only half a brick was used and the other half thrown away. It is actually saved for another row in another wall. The same thing applies for a 2-row and a 5-row wall. You are saving the extra half brick for another wall. |
|
Great! We have a table.
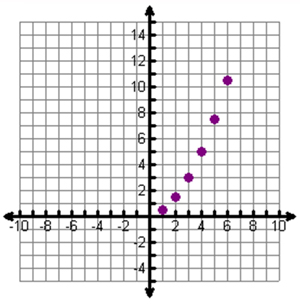
Next we'll graph the data from the table. Let's plot these points. Think about how you would set up a graph of this data.
Check out the graph below.
 |
|
That doesn't look like a line.
At this point, you may or may not be able to come up with the expression on your own. Let's come up with the expression by answering the following multiple choice question.
Collecting Your Own Data
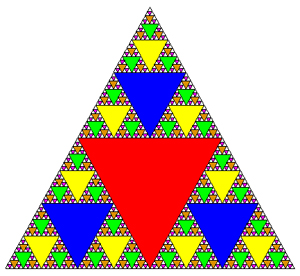
In this activity, you will investigate the stages of Sierpinski's Triangle using the following interactive applet.
|
Using the applet below, click on the "Next Stage" button and collect data. Use the data to complete the table shown below in your notes.
|
 Source: Triangles with a triangle, Allen Centre, Wikispaces |


