Introduction
In previous grades, you used different statistical measures to describe the central tendency and variability, or spread, of a data set.
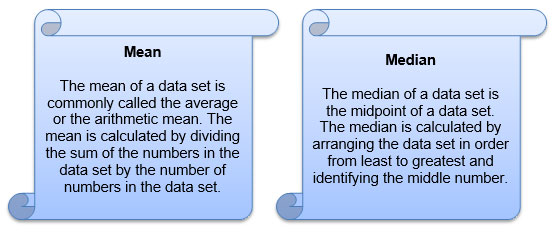
Central Tendency
The central tendency of a data set is used to describe the “typical” value in a data set. Two common measures of central tendency are mean and median.
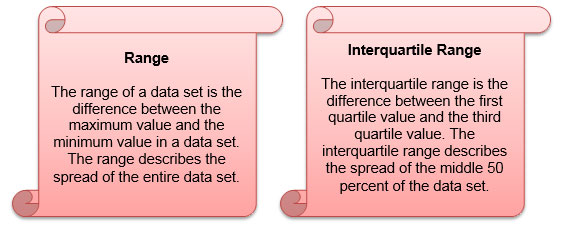
Variability
The variability, or spread, of a data set is used to describe how far apart the numbers are in a data set. Two commonly used measures of variability are range and interquartile range.
In this lesson, you will investigate an additional measure of variability, the mean absolute deviation. The mean absolute deviation of a data set tells you the typical distance between each number in the data set and the mean of the data set.
Representing and Calculating Mean
In previous grades, you learned how to calculate the mean, or arithmetic mean, of a set of numbers. In this section, you will review how to calculate the mean of a data set.
Consider the following problem.
A collection of shoes in a shoe store has the following shoe sizes.
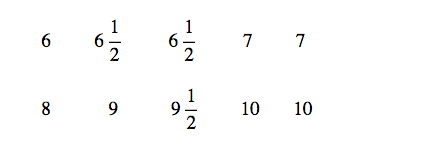

What is the mean size of the shoes in the collection?
See how Marley calculated the mean shoe size in the collection.
Graphically, you can locate the mean of a set of numbers on a number line. If you plot the data set on a dot plot, then the mean is a balancing point. In other words, if the number line was a balance beam, and each number was plotted with an object of equal weight, the number line would be perfectly balanced if the fulcrum were placed at the mean.
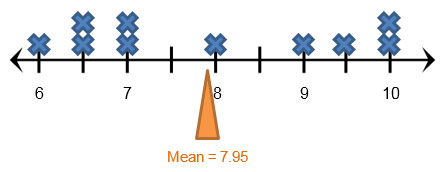
In our example above, the mean of 7.95, even though it’s not a shoe size, represents the balancing point for the set of shoes in the collection.
Pause and Reflect
Summarize how you can calculate the arithmetic mean, or mean, of a set of seven numbers.
Practice
1. Devon collected data about the maximum speeds of eight popular roller coasters. In miles per hour, the speeds were: 45, 48, 55, 60, 72, 74, 76, and 80. What is the mean speed for this set of roller coasters?
2. The top five and bottom five salaries for a particular professional baseball team are shown in the table below.
|
Baseball Team Salaries (millions of dollars)
|
|
|
Top Five Salaries
|
Bottom Five Salaries
|
|
33.00 24.35 22.80 20.33 16.45
|
0.47 0.45 0.43 0.44 0.41
|
What is the mean of the top five salaries for this baseball team?
3. The table below shows the average low temperatures for six Texas cities for the month of January.
|
City
|
Average January Low Temperature (°C)
|
|
Amarillo
|
-5
|
|
Laredo
|
8
|
|
Houston
|
6
|
|
El Paso
|
0
|
|
Texarkana
|
1
|
|
San Antonio
|
5
|
What is the mean of the average low temperatures for this set of Texas cities for the month of January?
Representing and Calculating Mean Absolute Deviation
In the last section, you calculated the mean of a data set. In this section, you will use the mean to calculate the mean absolute deviation of a set of data.
Mean absolute deviation is the mean of the absolute values of the deviations, or differences, between each number in the data set and the mean of the data set.
Mean is a useful measure for identifying a "typical" value in a data set, but sometimes, you also need to know how far the data set is spread out.
Consider the data table below, which shows the charge times, in hours, of two different computer batteries.
| Battery A | 2 | 3 | 3.5 | 3 | 4 | 5 | 6.5 | 7 | 8 | 8 |
| Battery B | 4 | 4 | 4 | 5 | 5 | 5 | 5 | 6 | 6 | 6 |
Calculate the mean battery charge time for each battery.
Construct a dot plot for each of the batteries. To do so, click and drag the point from the number onto the number line.
- What do you notice about the variability, or spread, of Battery A compared to Battery B when you study the dot plots?
- How does the variability of the data for each battery compare to the mean of the data values for each battery?
You can use mean absolute deviation to determine exactly how spread out a set of data is from the mean.
See how Marley calculated the mean absolute deviation for Battery A.
Repeat the process that Marley used to calculate the mean absolute deviation for the data set from Battery B.
|
Battery B
|
4
|
4
|
4
|
5
|
5
|
5
|
5
|
6
|
6
|
6
|
Pause and Reflect
- How does the mean absolute deviation for Battery A and Battery B compare to what you observed in the dot plots for Battery A and Battery B?
- How does mean absolute deviation describe the spread of a data set from the mean of the data set?
Practice
1. Devon recorded the maximum speeds of eight popular roller coasters. In miles per hour, the speeds were: 45, 48, 55, 60, 72, 74, 76, and 80. What is the mean absolute deviation for the speeds of this set of roller coasters?
2. The top five and bottom five salaries for a particular professional baseball team in a recent season are shown in the table below.
|
Baseball Team Salaries (millions of dollars)
|
|
|
Top Five Salaries
|
Bottom Five Salaries
|
|
33.00 24.35 22.80 20.33 16.45
|
0.47 0.45 0.43 0.44 0.41
|
What is the approximate mean absolute deviation of the top five salaries for this baseball team?
3. The table below shows the average low temperatures for six Texas cities for the month of January.
|
City
|
Average January Low
Temperature (°C) |
|
Amarillo
|
-5
|
|
Laredo
|
8
|
|
Houston
|
6
|
|
El Paso
|
0
|
|
Texarkana
|
1
|
|
San Antonio
|
5
|
What is the approximate mean absolute deviation of the average low temperatures for this set of Texas cities for the month of January?
Summary
In this lesson, you investigated mean absolute deviation, which is a statistical measure to describe the variability, or spread, of a data set.
The mean absolute deviation is the average of the differences (deviations) of each value in the data set from the mean of the data set.
Graphically, the deviations can be represented on a number line from a dot plot.
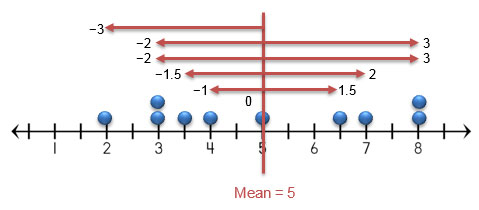
Numerically, the absolute deviations can be represented using the absolute value. The mean is calculated by adding the absolute deviations together, and then dividing by the number of values in the data set.
|-3| + |-2| + |-2| + |-1.5| + |-1| + |0| + |1.5| + |2| + |3| + |3| = 19
19 ÷ 10 = 1.9