Solving Problems with Graphs

Previously, you learned how to display information as an equation, a graph, and as a table. This lesson will focus on using equations, graphs, and tables to solve problems. Read the following situation. Use the graph below to answer the questions. If you need a hint, click on the word hint.
Tanya and James are working together on an experiment in their science class. They are instructed by their teacher to place a beaker full of water over a flame and take temperature readings each minute while it heats for 7 minutes. The graph of their results is shown below.
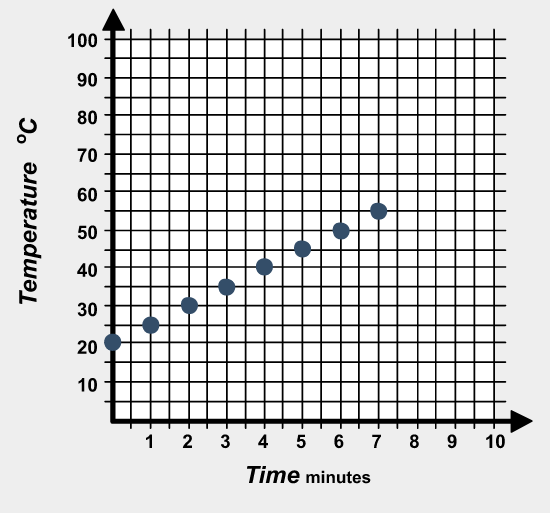
- What was the temperature of the water at 2 minutes?
- How did you find the temperature at 2 minutes from the graph?
- What was the temperature of the water at 3 minutes?
- How did you find the temperature at 3 minutes from the graph?
Graph Practice Problem

Marco has decided to try skydiving, and he is very nervous. He searched the internet for information, and downloaded the following graph. The graph shows the height of a typical skydiver in feet as related to the time in minutes after the parachute has opened.
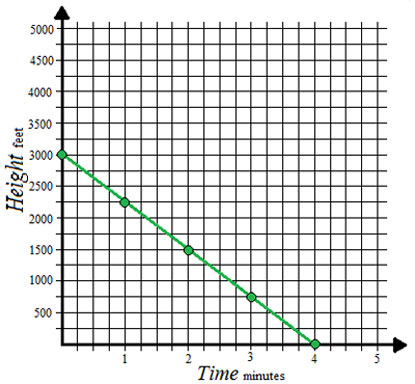
Answer the following questions based on the information shown in the graph.
Solving Problems with Tables

Many problem situations can be solved by using information that has been organized into data tables.
A small town measures its population every 5 years and records it in a table that is kept in the town hall. A portion of the data table is shown below.
|
Year
|
Population
|
|
1990
|
11,500
|
|
1995
|
11,750
|
|
2000
|
12,000
|
|
2005
|
12,250
|
|
2010
|
12,500
|
Now, answer the questions below based on the data in the table.

The following table shows the monthly cost of a pay-as-you-go cell phone plan.
|
Minutes Used
|
Cost
|
|
25
|
$19
|
|
50
|
$24
|
|
75
|
$29
|
|
100
|
$34
|
|
125
|
$39
|
|
150
|
$44
|
Much like we saw with graphs, some solutions to problems can be read directly from data tables, while others can be found by using a pattern set by the table.
Using Equations
When working with problems involving equations, you can determine solutions by substituting a known value into the equation and then using mathematical operations to calculate a result.
 Matt is driving 63 miles per hour on a long road trip. The equation d = 63t can be used to calculate d, the distance Matt drove in t hours. Find the distance that Matt drives in 4 hours.

Three friends are eating dinner together at a restaurant. They are trying to figure out t, the amount of tip to leave for a meal that costs c dollars. To calculate the tip, they are using the equation t = 0.15c. Their dinners cost $11.90, $10.95, and $10.45. How much of a tip should they leave?
 An electrician charges a set fee of $50 plus $35 per hour for repairs. Using the equation c = 50 + 35t, what will be the total cost, c, of a repair that takes 6 hours to complete?
Summary
When using a graph to solve equations, remember the following important rules:
- A point on the graph represents both an x value and a y value. Reading the point off the graph can give you an answer for either value.
- To read between points on a graph, it is helpful to sketch a line between them to help estimate the correct answer.
- To use the graph to predict something that hasn't happened yet, connect the data points with a line that extends beyond the data, and use that line to make your prediction.
Much like with graphs, some solutions to problems can be read directly from data tables, while others can be found by using a pattern set by the table.
When working with problems involving equations, you can determine solutions by substituting a known value into the equation and then using mathematical operations to calculate a result.
Based on what you have learned from this lesson, read and solve the following problem. Click each hint button if you need help.

Marco is making cookies for a fundraising bake sale at school. The recipe makes 3 dozen cookies and calls for 2 cups of sugar. How many cups of sugar will Marco need if he wants to make 7 dozen cookies?