Test Prep for AP® Courses
- 3’ poly-A tails
- 5’ caps
- promoters
- introns
The enzyme polyadenylate polymerase catalyzes the addition of adenosine monophosphate to the 3’ ends of mRNAs to form a poly-A tail. If the enzyme were blocked so that it could not function, the result would be ________.
- increased mRNA stability in eukaryotes, and decreased mRNA stability in prokaryotes
- decreased mRNA stability in eukaryotes, and no effect in prokaryotes
- no effect in eukaryotes, and increased mRNA stability in prokaryotes
- no effect in eukaryotes, and decreased mRNA stability in prokaryotes
Describe two ways in which gene regulation differs and two ways in which it is similar in prokaryotes and eukaryotes.
- Prokaryotes show co-transcriptional translation whereas eukaryotes perform transcription prior to translation; in both cell types, regulation occurs through the binding of transcription factors, activators, and repressors.
- Prokaryotes perform transcription prior to translation whereas eukaryotes show co-transcriptional translation that is, the processes occur in the same organelle.
- Prokaryotes show co-transcriptional translation that is regulated prior to translation whereas eukaryotes perform transcription prior to translation that is regulated only at the level of transcription. In both domains, transcription factors, activators, and repressors provide regulation.
- Prokaryotes show co-transcriptional translation that occurs in the nucleus whereas eukaryotes show transcription prior to translation. In both cell types, regulation occurs using transcription factors, activators, and repressors.
a.

b.

c.

d.

Lactose digestion in E. coli begins with its hydrolysis by the enzyme β-galactosidase. The gene encoding β-galactosidase, lacZ, is part of a coordinately regulated operon containing other genes required for lactose utilization. Which of the figures correctly depicts the interactions at the lac operon when lactose is not being utilized?
- (a)
- (b)
- (c)
- (d)
- The repressor will bind to lactose when it is removed from the operator.
- The repressor will bind the operator in the presence of lactose.
- The repressor will not bind the operator in the presence of lactose.
- The repressor will not bind the operator in the absence of lactose.
- The DNA will have many methyl molecules.
- The DNA will have many acetyl molecules.
- The DNA will have few methyl groups.
- The histones will have many acetyl groups.
- The DNA will have many methyl molecules.
- The DNA will have many acetyl molecules.
- The DNA will have few methyl groups.
- The histones will have few acetyl groups.
The level of transcription of a gene is tested by creating deletions in the gene as shown in the illustration. These modified genes are tested for their level of transcription: (++) normal transcription levels; (+) low transcription levels; (+++) high transcription levels.

Which deletion is in an enhancer involved in regulating the gene?
- deletion 1
- deletion 2
- deletion 3
- deletion 4
In the figure, which deletion is in a repressor involved in regulating the gene?
- deletion 1
- deletion 2
- deletion 3
- deletion 4
50.
The diagram shows different regions (1–5) of a pre-mRNA molecule, a mature-mRNA molecule, and the protein corresponding to the mRNA.

A mutation in which region is most likely to be damaging to the cell?
- Region 1
- Region 2
- Region 3
- Region 4
What do regions 1 and 5 correspond to?

- exons
- introns
- promoters
- untranslated regions
What are regions 1 through 5 in the diagram?

- Regions 1, 3, and 5 are exons; region 2 and 4 are introns.
- Regions 2 and 4 are exons; region 1, are introns.
- Regions 1 and 5 are exons; region 2, 3, and 4 are introns.
- Regions 2, 3, and 4 are exons; region 1 and 5 are introns.
A mutation results in the formation of the mutated mature-mRNA as indicated in the diagram. What type of mutation occurred, and what is the likely outcome of the mutation?
- Mutation in the GU-AG sites of introns produced a non-functional protein.
- A transversion mutation in the introns led to alternative splicing, producing a functional protein.
- A transversion mutation in the GU-AG site mutated this mRNA, producing a non-functional protein.
- Transition mutations in the introns could produce a functional protein.
The diagram illustrates the role of p53 in response to UV exposure. What would be the result of a mutation in the p53 gene that inactivates it?
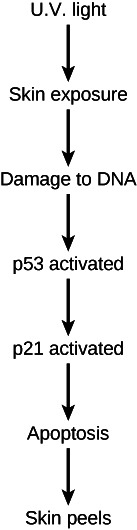
The diagram illustrates the role of p53 in response to UV exposure. What would be the result of a mutation in the p53 gene that inactivates it?
- Skin will peel in response to UV exposure.
- Apoptosis will occur in response to UV exposure.
- No DNA damage will occur in response to UV exposure.
- No peeling of skin will occur in response to UV exposure.
What will NOT occur in response to UV exposure if a p53 mutation inactivates the p53 protein?
b. p21 activation and apoptosis
c. p21 activation
d. p53 activation, p21 activation, and apoptosis
What happens when tryptophan is present?

- The repressor binds to the operator, and RNA synthesis is blocked.
- RNA polymerase binds to the operator, and RNA synthesis is blocked.
- Tryptophan binds to the repressor, and RNA synthesis proceeds.
- Tryptophan binds to RNA polymerase, and RNA synthesis proceeds.
What happens in the absence of tryptophan?
- RNA polymerase binds to the repressor
- the repressor binds to the promoter
- the repressor dissociates from the operator
- RNA polymerase dissociates from the promoter
Anabaena is a simple multicellular photosynthetic cyanobacterium. In the absence of fixed nitrogen, certain newly developing cells along a filament express genes that code for nitrogen-fixing enzymes and become non-photosynthetic heterocysts. The specialization is advantageous because some nitrogen-fixing enzymes function best in the absence of oxygen. Heterocysts do not carry out photosynthesis, but instead provide adjacent cells with fixed nitrogen and receive fixed carbon and reduced energy carriers in return. As shown in the diagram, when there is low fixed nitrogen in the environment, an increase in the concentration of free calcium ions and 2-oxyglutarate stimulates the expression of genes that produce two transcription factors (NtcA and HetR) that promote the expression of genes responsible for heterocyst development. HetR also causes production of a signal, PatS, that prevents adjacent cells from developing as heterocysts.

- In an environment with low fixed nitrogen, treating the Anabaena cells with a calcium-binding compound should prevent heterocyst differentiation.
- A strain that overexpresses the patS gene should develop many more heterocysts in a low nitrogen environment.
- In an environment with abundant fixed nitrogen, free calcium levels should be high in all cells, preventing heterocysts from developing.
- In environments with abundant fixed nitrogen, loss of the hetR gene should induce heterocyst development.
Which statement about Anabaena is false?

- Decreasing the concentration of free calcium ions will prevent heterocyst development.
- In the presence of fixed nitrogen, NtcA will not be expressed.
- Low fixed nitrogen levels result in increased PatS levels.
- A mutation in NtcA that makes it nonfunctional will also allow adjacent cells to develop as heterocysts.